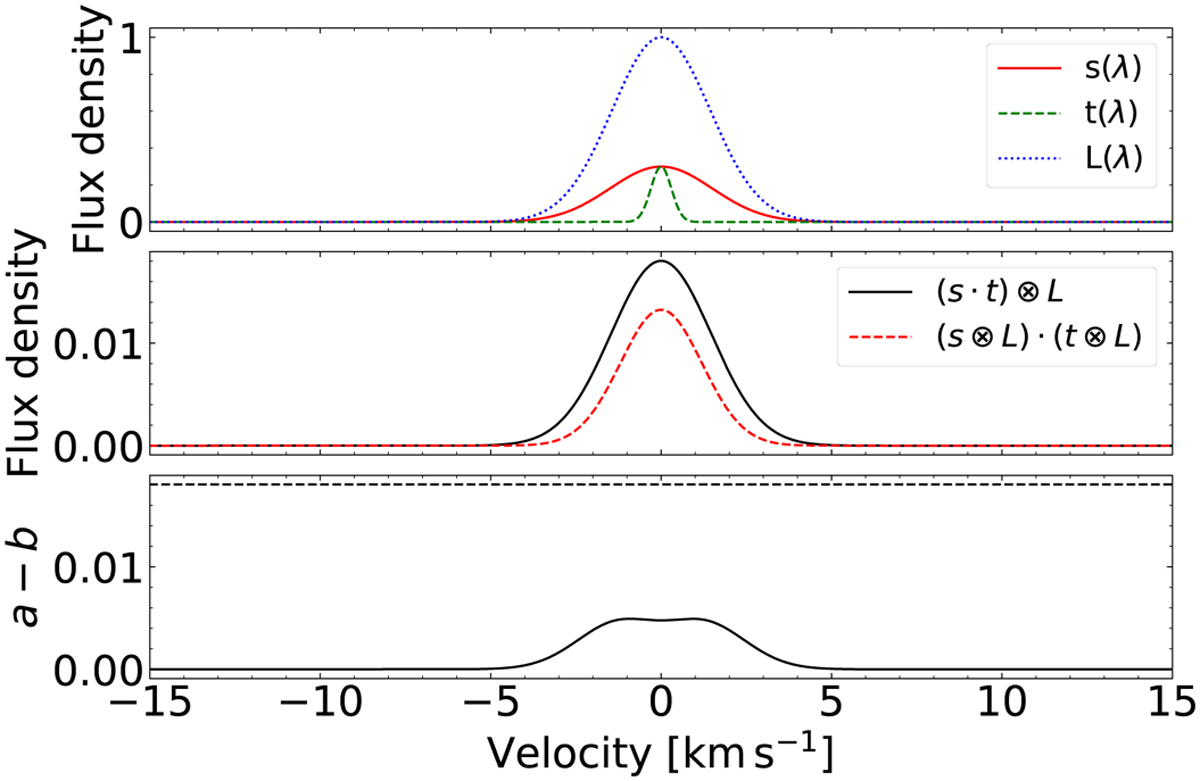
Fig. A.1
Download original image
Approximation of the convolution function for the special case where a stellar line is blended by a telluric line (µs = µt). Upper panel: Artificial line profiles representing a stellar line (red line), a telluric line (dashed green line), and the instrumental line profile (dotted blue line, normalized for the sake of clarity). Middle panel: Left and right side of Eq. (A.1). Lower panel: Difference between the left and right side of Eq. (A.1) expressed by a − b. The dashed line indicates the limit set by the product of the line depths, ![]() .
.
Current usage metrics show cumulative count of Article Views (full-text article views including HTML views, PDF and ePub downloads, according to the available data) and Abstracts Views on Vision4Press platform.
Data correspond to usage on the plateform after 2015. The current usage metrics is available 48-96 hours after online publication and is updated daily on week days.
Initial download of the metrics may take a while.