Fig. 9
Download original image
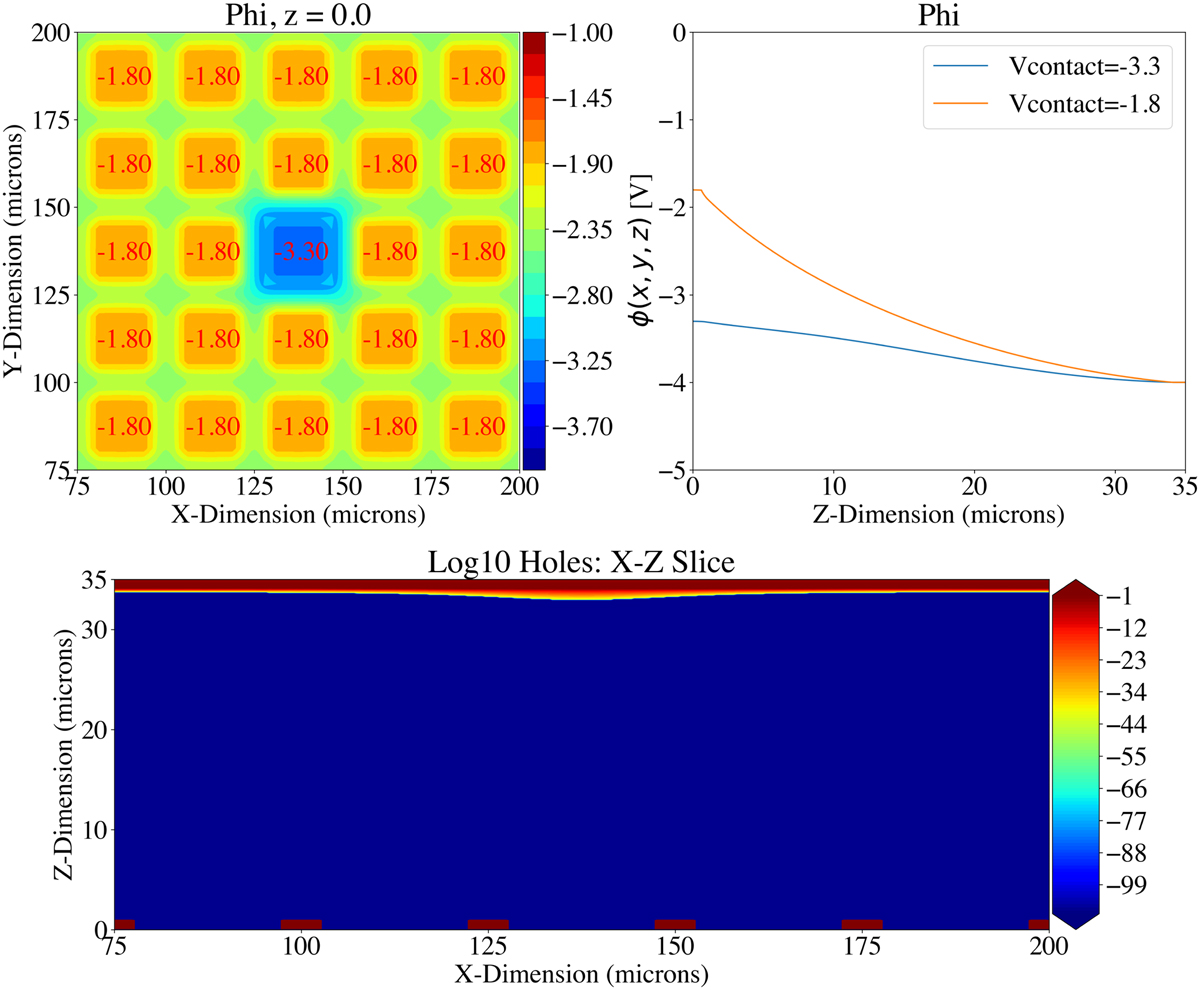
Poisson_CCD output plot of a basic MIRI detector model simulation. Top left: Poisson’s equation solved for a five-by-five grid of pixels; a localized voltage de-bias of −1.5 V is applied at the middle pixel. Top right: electrostatic potential as a function of detector depth. Z = 0 µm is located at the pixel, and Z = 35 µm is located at the top of the buried contact. Bottom: MIRI detector infrared-active layer. The blue shading shows areas where the active layer is fully depleted. Yellow and red shading show areas where the active layer is un-depleted. The buried contact is located at Z = 34–35 µm. The dark red boxes at Z = 0–1 µm illustrate the regions not covered by the detector front side contact.
Current usage metrics show cumulative count of Article Views (full-text article views including HTML views, PDF and ePub downloads, according to the available data) and Abstracts Views on Vision4Press platform.
Data correspond to usage on the plateform after 2015. The current usage metrics is available 48-96 hours after online publication and is updated daily on week days.
Initial download of the metrics may take a while.