Fig. 5

Download original image
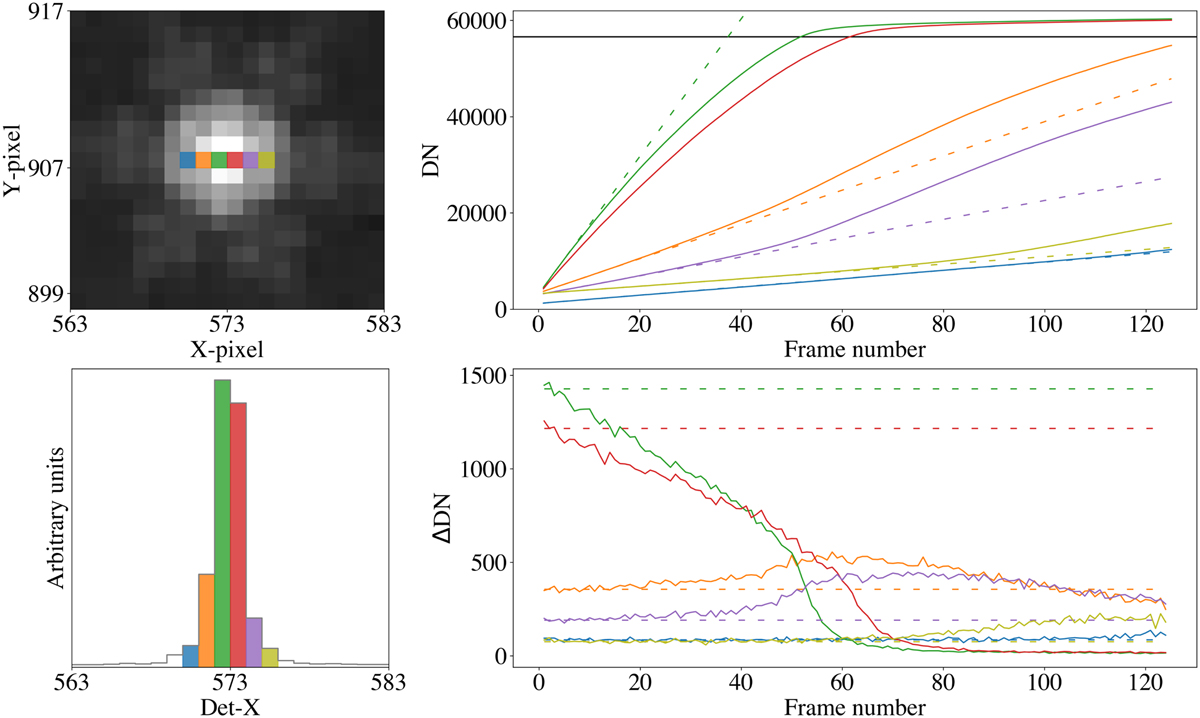
MIRI F560W imager data of an unresolved point source observed during the JWST commissioning phase. Top left: reduced MIRI imaging data plotted in log scale. Six pixels are selected in detector row 907 across the horizontal width of the PSF (colored boxes). Bottom left: signal distribution across detector row 907. The same color is used for the selected pixels in the top-left panel. Top right: raw pixel voltage integration ramps of the pixels selected in the top-left panel (solid colored lines). The loosely dashed colored lines are linear regressions on the first five frames of the selected ramps. The blue ramp has been shifted down by 2000 DNs for clarity. The horizontal black line at 56 600 DNs shows the saturation value for the MIRI imager pixels. Bottom right: subsequent frame differences of ramps shown in the top-right panel (∆DN = DNi+1 − DNi). The loosely dashed colored lines are the slopes determined from the linear regressions on the first five frames of the selected ramps.
Current usage metrics show cumulative count of Article Views (full-text article views including HTML views, PDF and ePub downloads, according to the available data) and Abstracts Views on Vision4Press platform.
Data correspond to usage on the plateform after 2015. The current usage metrics is available 48-96 hours after online publication and is updated daily on week days.
Initial download of the metrics may take a while.


