Fig. 11
Download original image
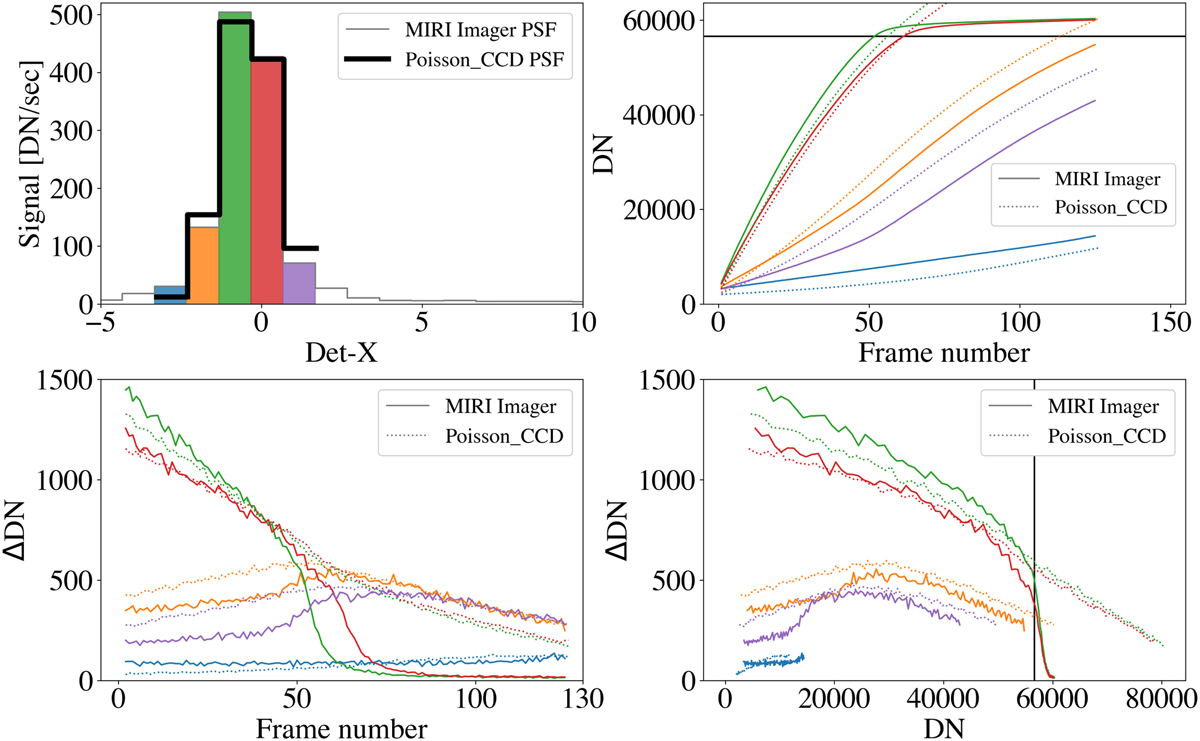
Modeling the MIRI detector pixel integration ramps using Poisson_CCD. Top left: signal distribution in the MIRI imager PSF in 1D versus the Poisson_CCD simulated PSF (2D Gaussian). Both PSFs are centered on the x-axis using their respective centroids. Top right: MIRI imager raw ramps (solid colored curves) and ramps from the Poisson_CCD simulation output (dotted lines). The frame number in the case of the Poisson_CCD simulation corresponds to how many times N = 45 000 tracers have been added to the simulation. To compute the DN level for the simulated pixels, the number of electrons that reached each pixel in each simulation step was divided by the pixel gain of 5.5 e− DN−1. For visualization purposes, we offset the Poisson_CCD vertically by 2000 DNs. Bottom left: subsequent frame differences as a function of time (frame number). Bottom right: subsequent frame difference as a function of the pixel absolute DN level. The vertical black line shows the saturation limit.
Current usage metrics show cumulative count of Article Views (full-text article views including HTML views, PDF and ePub downloads, according to the available data) and Abstracts Views on Vision4Press platform.
Data correspond to usage on the plateform after 2015. The current usage metrics is available 48-96 hours after online publication and is updated daily on week days.
Initial download of the metrics may take a while.