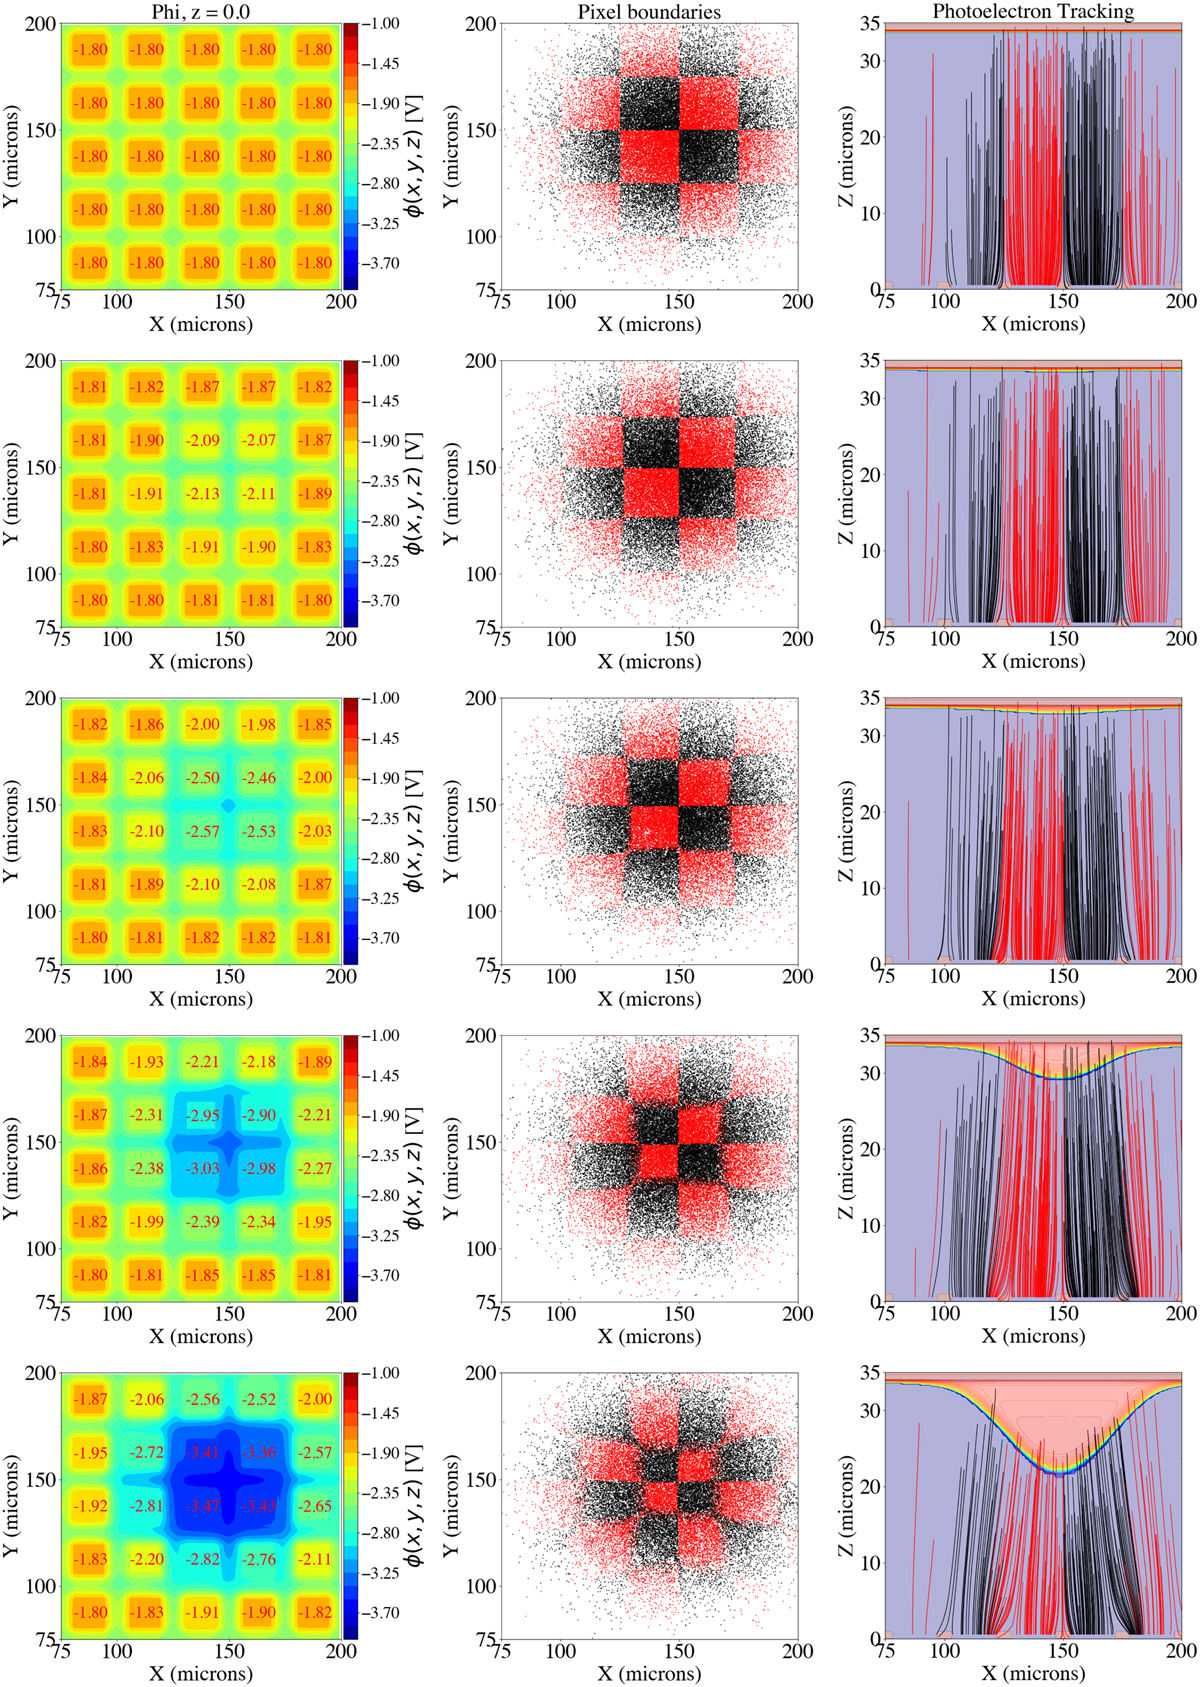
Fig. 10
Download original image
BFE in the MIRI detector model simulation. Left column: distribution of the electrostatic potential, ϕ, across the five-by-five simulation pixel grid. Middle column: location on the pixel geometric grid where each produced photoelectron landed. Neighboring pixels are given alternating colors. This probes the effective pixel collecting area change due to the de-biasing. Right column: photoelectron generation in infrared-active layer and photoelectron path tracking. The light pink region is the un-depleted region, which grows as the pixel accumulates more charge. Going from the top to the bottom row, the model is injected with 1, 10, 25, 45, and 75 times N = 45 000 tracers.
Current usage metrics show cumulative count of Article Views (full-text article views including HTML views, PDF and ePub downloads, according to the available data) and Abstracts Views on Vision4Press platform.
Data correspond to usage on the plateform after 2015. The current usage metrics is available 48-96 hours after online publication and is updated daily on week days.
Initial download of the metrics may take a while.