Fig. 7
Download original image
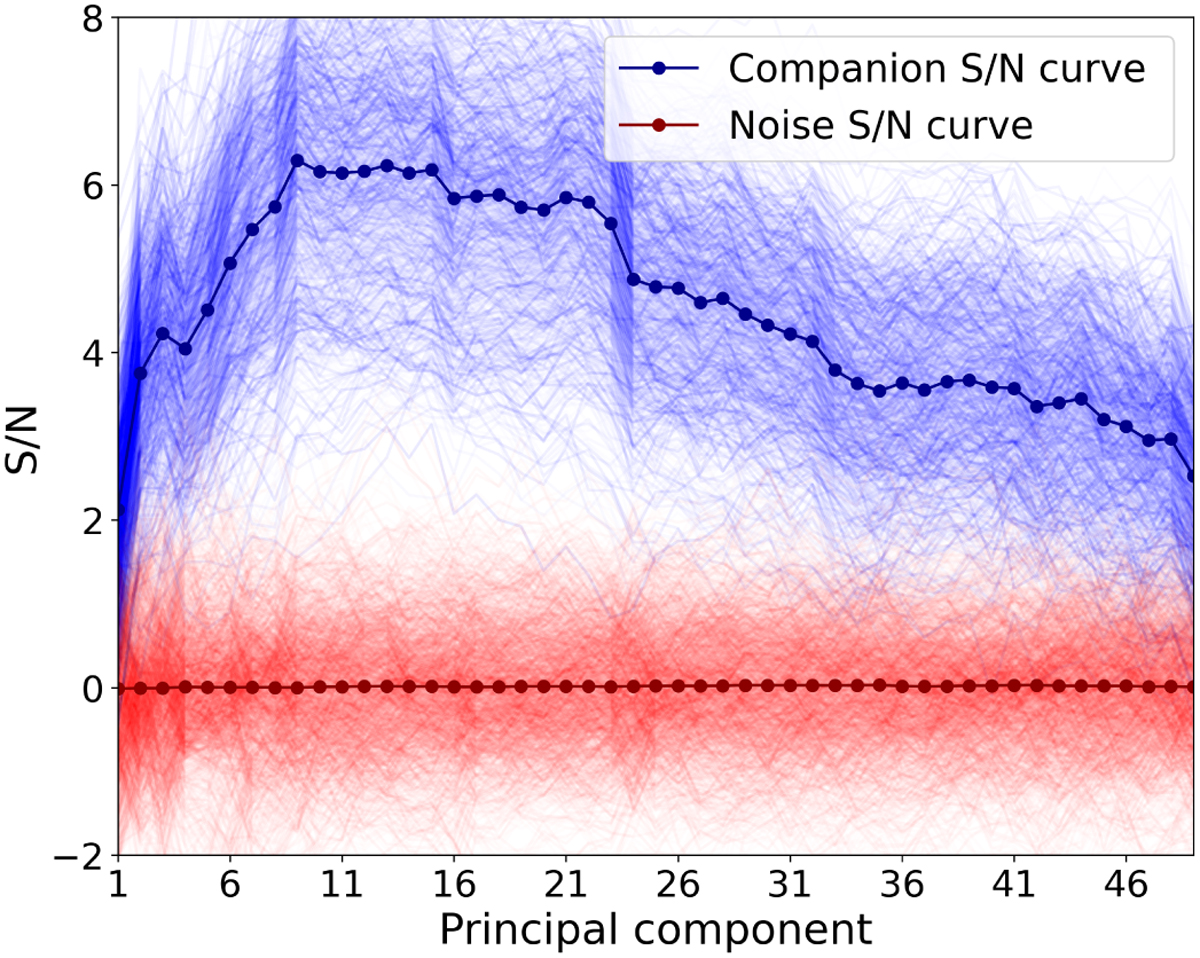
S/N curves generated from the sph2 cube of processed frames at a 8λ/D distance from the star. Curves in blue contain the exoplanet signature and curves in red just residual noise. The flux of injections is randomly selected from a range that is between one and three times the level of noise. Dotted curves over populations show the mean of each class.
Current usage metrics show cumulative count of Article Views (full-text article views including HTML views, PDF and ePub downloads, according to the available data) and Abstracts Views on Vision4Press platform.
Data correspond to usage on the plateform after 2015. The current usage metrics is available 48-96 hours after online publication and is updated daily on week days.
Initial download of the metrics may take a while.