Fig. 4
Download original image
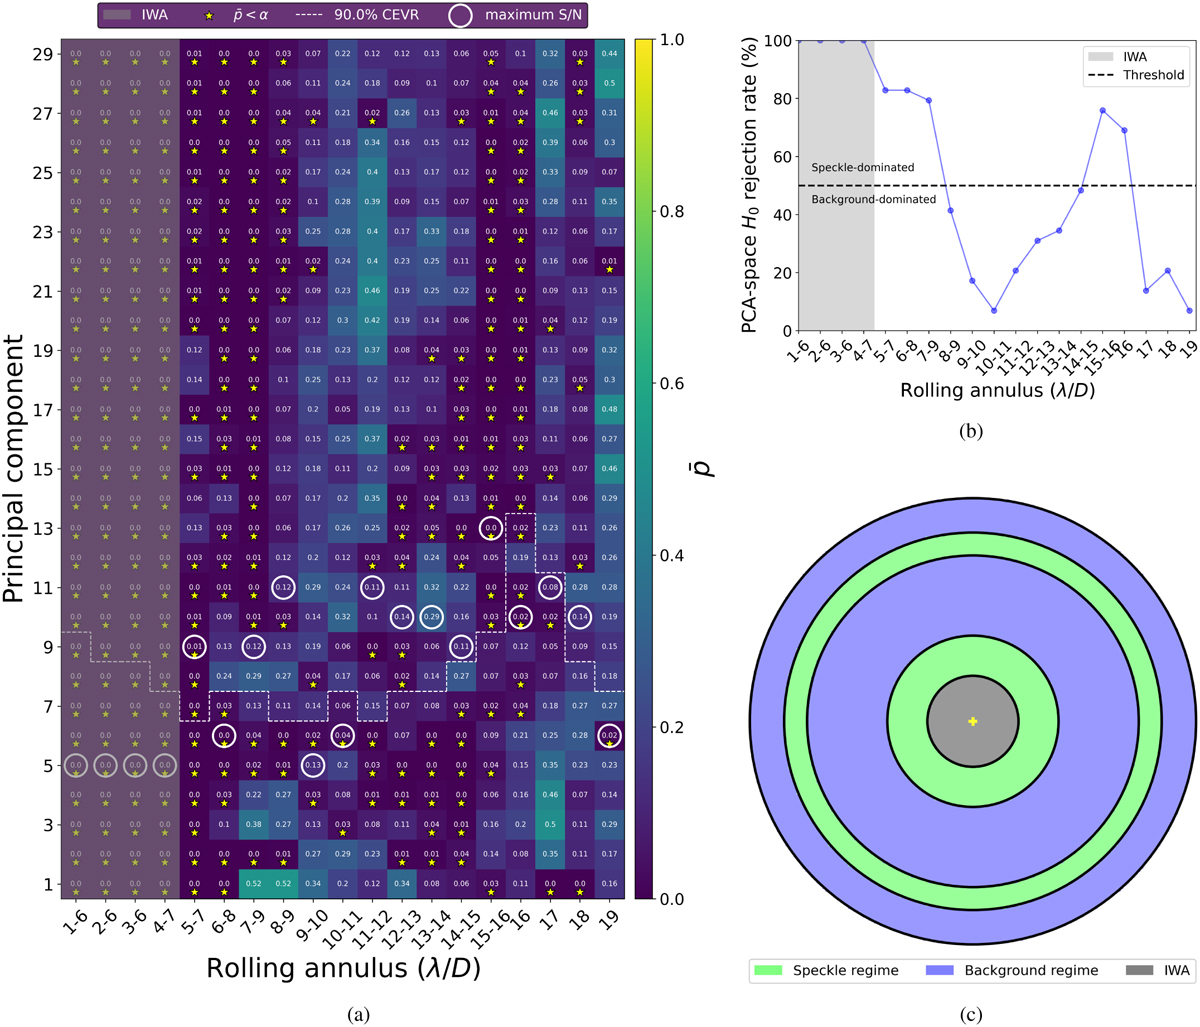
Combined normality test analysis for the sph2 ADI sequence. (a) PCA-pmap showing the combined p-value ![]() both as a colour code and as values, as a function of the distance to the star through the rolling annulus (x axis) and the number of principal components used in the PCA-based PSF subtraction (y axis). Yellow star markers indicate when the null hypothesis H0 (Gaussian noise) is rejected. The white dashed line shows the 90% CEVR at each rolling annulus. White circles in bold highlight the principal component that maximizes the S/N of fake companion recoveries. (b) Percentage of yellow star markers, or H0 rejection, (y axis) for each rolling annulus (x axis) on the PCA-pmap. The dashed black line highlights the selection criteria for setting the dominant noise at each rolling annulus. (c) Final representation of estimated noise regimes along the processed frames field of view. Grey areas in each subplot highlight the inner working angle (denoted as IWA).
both as a colour code and as values, as a function of the distance to the star through the rolling annulus (x axis) and the number of principal components used in the PCA-based PSF subtraction (y axis). Yellow star markers indicate when the null hypothesis H0 (Gaussian noise) is rejected. The white dashed line shows the 90% CEVR at each rolling annulus. White circles in bold highlight the principal component that maximizes the S/N of fake companion recoveries. (b) Percentage of yellow star markers, or H0 rejection, (y axis) for each rolling annulus (x axis) on the PCA-pmap. The dashed black line highlights the selection criteria for setting the dominant noise at each rolling annulus. (c) Final representation of estimated noise regimes along the processed frames field of view. Grey areas in each subplot highlight the inner working angle (denoted as IWA).
Current usage metrics show cumulative count of Article Views (full-text article views including HTML views, PDF and ePub downloads, according to the available data) and Abstracts Views on Vision4Press platform.
Data correspond to usage on the plateform after 2015. The current usage metrics is available 48-96 hours after online publication and is updated daily on week days.
Initial download of the metrics may take a while.