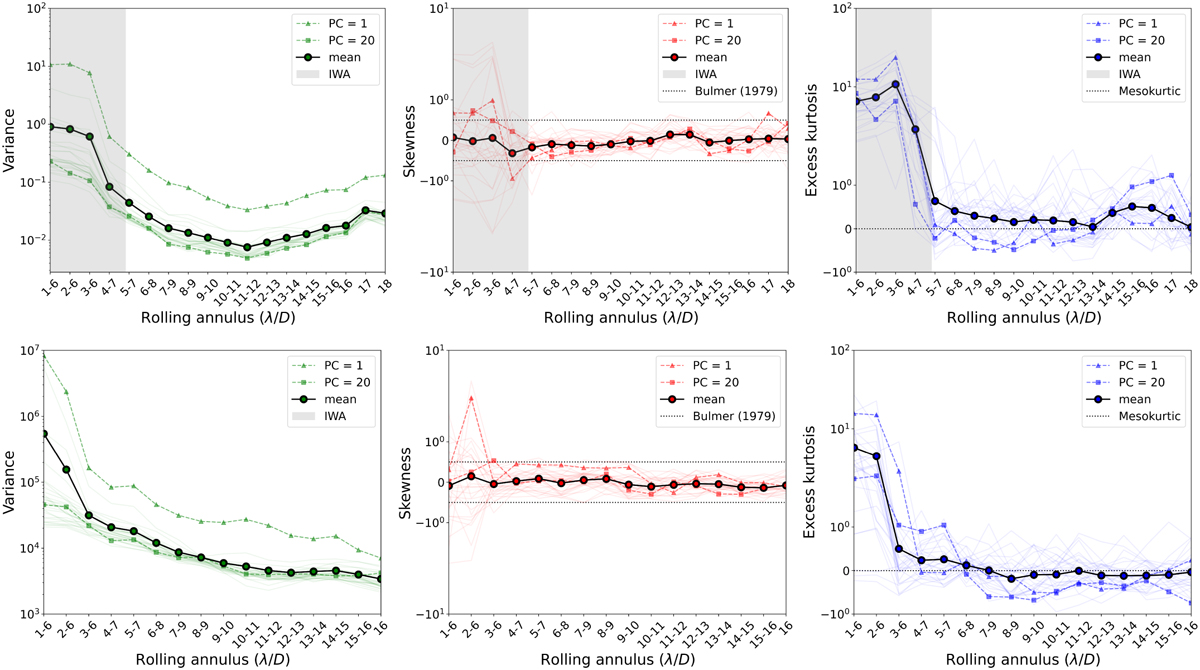
Fig. 3
Download original image
Statistical moments evolution based on a rolling annulus which paves the full annular-PCA processed frame. The top and bottom rows refer, respectively, to the sph2 and nrc3 ADI sequences. Colour curves on each subplot refer to a different principal component ranging from one to thirty. The bold curve on top of each subplot indicates the average of the thirty PCs, and PC=1 and PC=20 are illustrated with specific symbols. In the case of sph2, grey areas highlight the inner working angle (IWA).
Current usage metrics show cumulative count of Article Views (full-text article views including HTML views, PDF and ePub downloads, according to the available data) and Abstracts Views on Vision4Press platform.
Data correspond to usage on the plateform after 2015. The current usage metrics is available 48-96 hours after online publication and is updated daily on week days.
Initial download of the metrics may take a while.