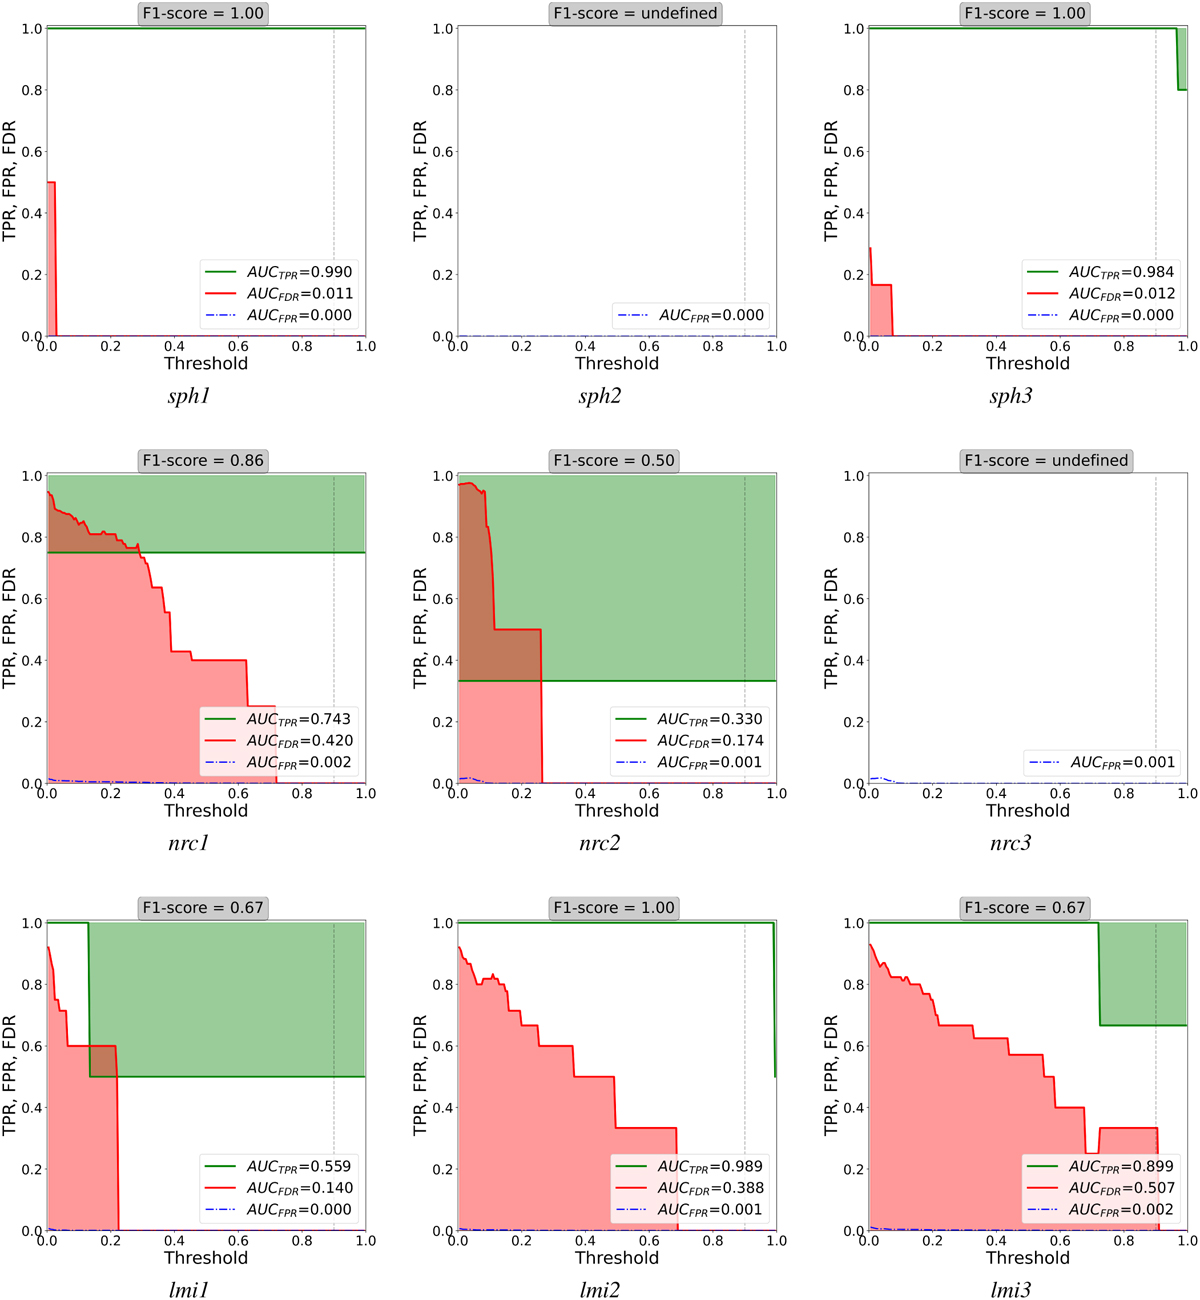
Fig. D.1
Download original image
TPR, FDR, and FPR metrics computed from the confidence maps of Fig. 11 for a range of confidence thresholds varying from zero to one. Their respective AUCs are shown in each legend. The F1-score is computed at the submitted threshold on the challenge τsub = 0.9 (vertical dashed line) and it is shown in the top of each subplot. When the dataset contains injections, TPR and FDR steply decrease with threshold, while FPR decreases monotonically. Thereby, an ideal algorithm would provide a TPR=1, FPR=0 and FDR=0 for any threshold and therefore, an AUCTPR = 1, AUCFPR = 0 and AUCFDR = 0. However, when the dataset does not have injections, the FPR is the only metric that can be defined as it does not depend on TPs.
Current usage metrics show cumulative count of Article Views (full-text article views including HTML views, PDF and ePub downloads, according to the available data) and Abstracts Views on Vision4Press platform.
Data correspond to usage on the plateform after 2015. The current usage metrics is available 48-96 hours after online publication and is updated daily on week days.
Initial download of the metrics may take a while.