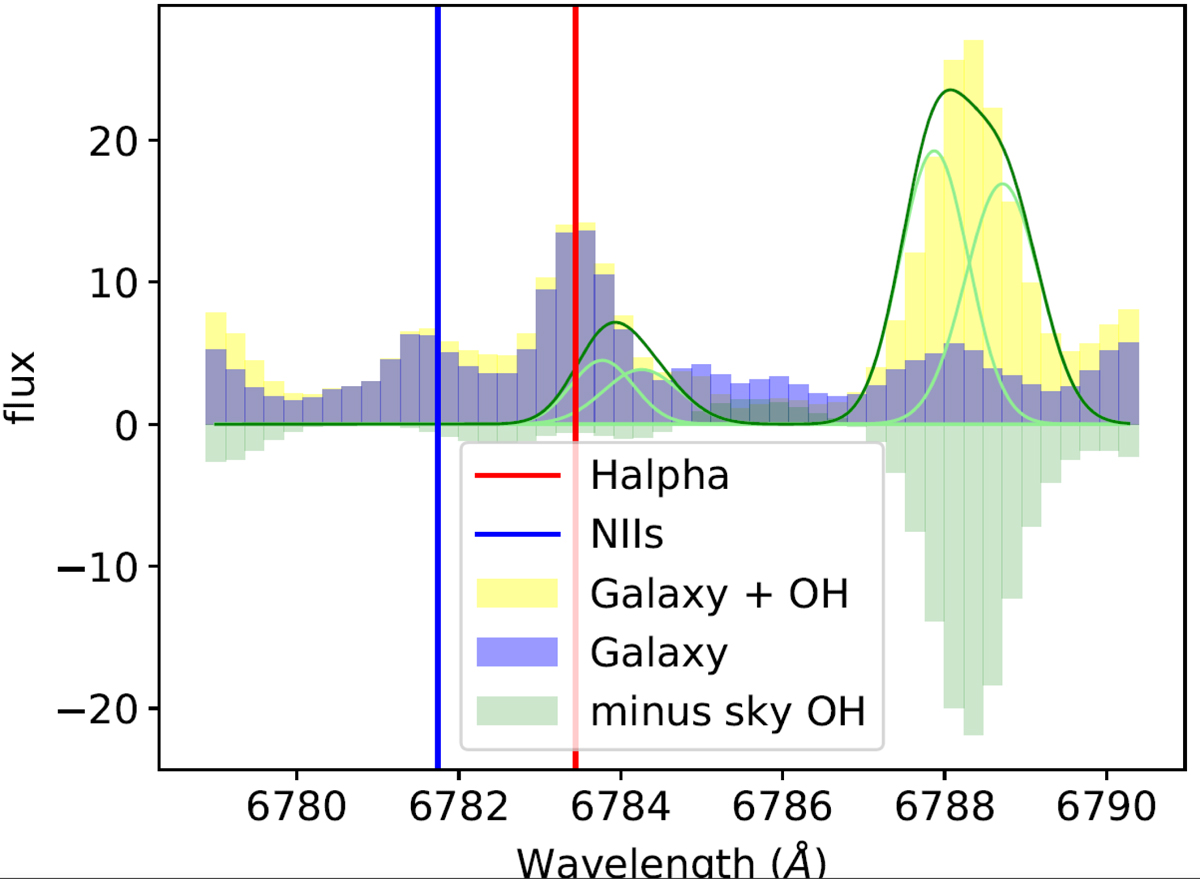
Fig. 9.
Download original image
GHASP high-resolution spectrum of the Hα/[NII] region measured on an area of ∼4.6 arcsec2 centered on the nucleus of the galaxy. Flux is in arbitrary units. The light green Gaussian curves are the expected individual OH night sky emission lines convolved at the line spread function of the instrument (∼10.7 km s−1). The dark green curve is the sum of the light green lines. The mirrored light green histogram is the galaxy-free OH night sky lines measured on a region of ∼3.2 arcmin2 around the galaxy. The net galaxy emission is given by the purple histogram. Vertical blue and red lines are the expected redshifted location of the [NII]@6584 and Hα, respectively. Due to the cyclic nature of the Fabry-Perot interferometer, the redshifted [NII]@6584 is shifted by minus two free spectral ranges (one FSR ∼ 11.51 Å) to the blue and is thus observed at ∼ − 2 Å from the Hα line.
Current usage metrics show cumulative count of Article Views (full-text article views including HTML views, PDF and ePub downloads, according to the available data) and Abstracts Views on Vision4Press platform.
Data correspond to usage on the plateform after 2015. The current usage metrics is available 48-96 hours after online publication and is updated daily on week days.
Initial download of the metrics may take a while.