Fig. 8.
Download original image
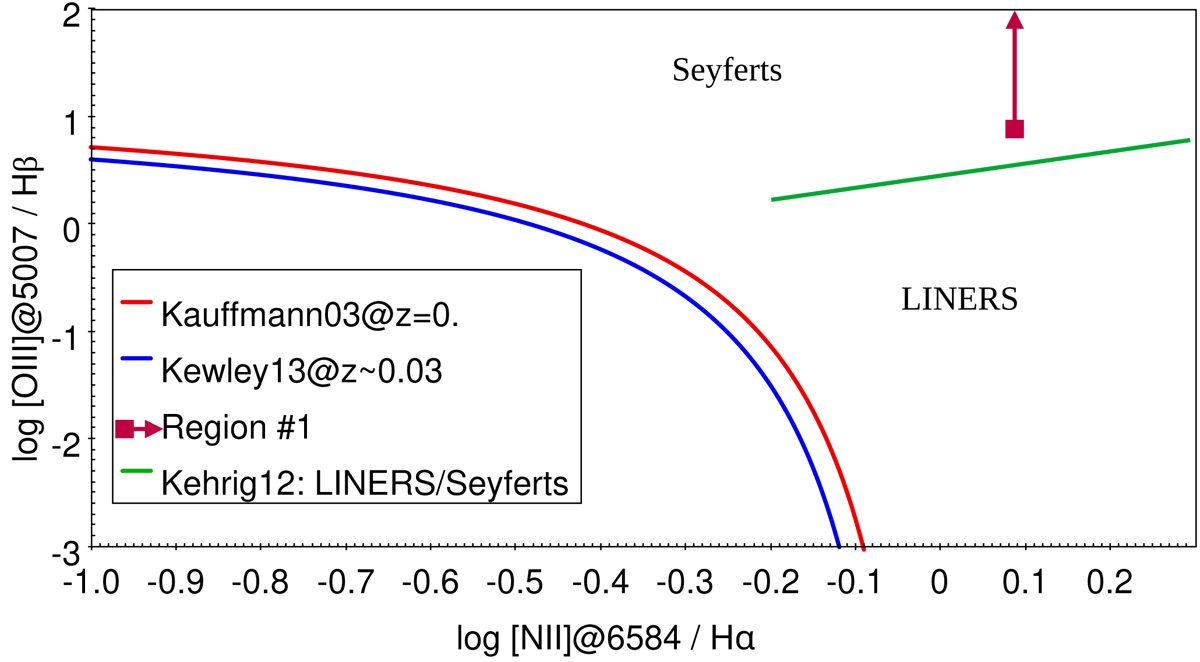
log([OIII]5007/Hβ) vs. log([NII]6584A/Hα) for MISTRAL region #1 spectrum. From Kauffmann et al. (2003) and Kewley et al. (2013), the areas under the red and blue curves are for normal galaxies, while areas above these curves are for active objects. The green line shows the delimitation between Seyfert and LINERS galaxies (Kehrig et al. 2012). The vertical dark magenta arrow is to indicate that NED02 Region 1 has detectable Hα, N[II]6584 and O[III]5007 emissions but no detectable Hβ flux. The bottom of this line shows the minimal value from the lower detection limit of Hβ.
Current usage metrics show cumulative count of Article Views (full-text article views including HTML views, PDF and ePub downloads, according to the available data) and Abstracts Views on Vision4Press platform.
Data correspond to usage on the plateform after 2015. The current usage metrics is available 48-96 hours after online publication and is updated daily on week days.
Initial download of the metrics may take a while.