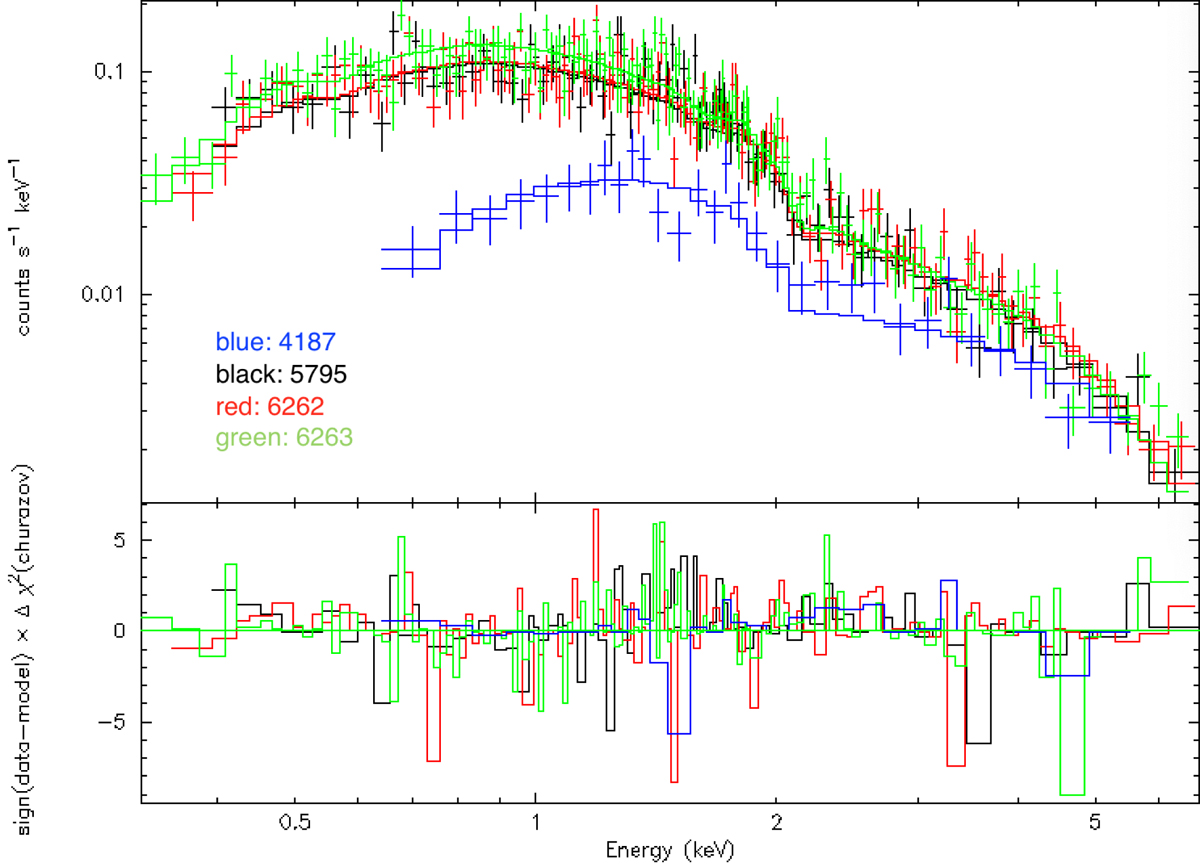
Fig. 5.
Download original image
Chandra spectral analysis. Top: data with best-fit single power-law model. Each colored line represents a different observation (identified by its ObsID, see Table 1). We note that the ObsID 4187 spectrum (blue curve) was performed with ACIS-I, while the other three were conducted with ACIS-S. Bottom: residues (data-model) in terms of the contribution to the χ2 for each energy bin in the spectrum.
Current usage metrics show cumulative count of Article Views (full-text article views including HTML views, PDF and ePub downloads, according to the available data) and Abstracts Views on Vision4Press platform.
Data correspond to usage on the plateform after 2015. The current usage metrics is available 48-96 hours after online publication and is updated daily on week days.
Initial download of the metrics may take a while.