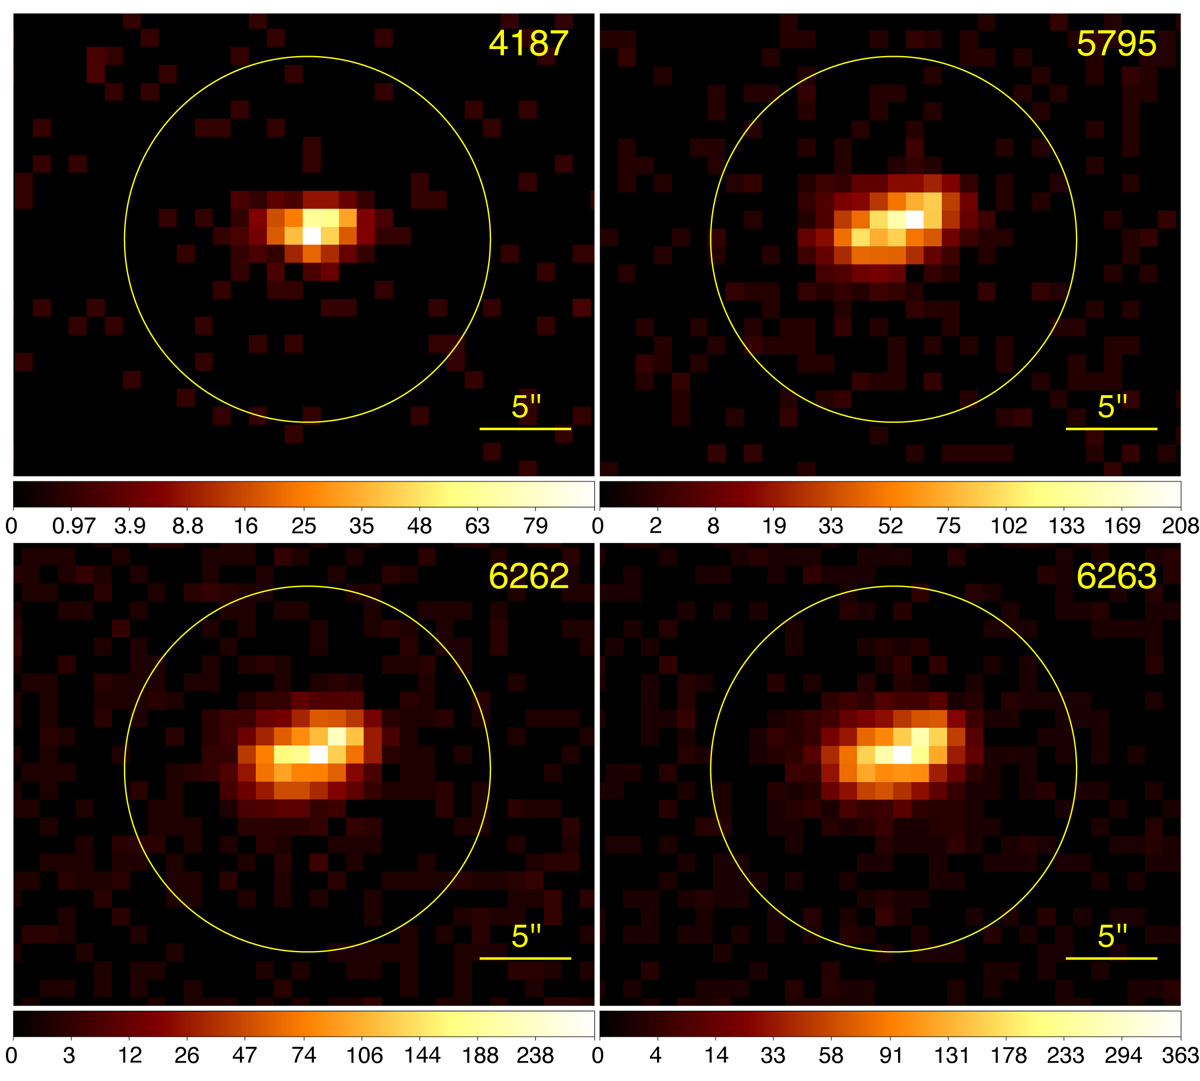
Fig. 3.
Download original image
Exposure-map corrected image of each Chandra observations. They are all broad-band, [0.5–7.0 keV]. The color scale is sqrt and color bar is in counts per pixel (1 pixel = 0.984″; for this image the “natural” ACIS pixel size was binned by a factor 2). The scale is in counts per pixel. North is up and East is left on all panels.
Current usage metrics show cumulative count of Article Views (full-text article views including HTML views, PDF and ePub downloads, according to the available data) and Abstracts Views on Vision4Press platform.
Data correspond to usage on the plateform after 2015. The current usage metrics is available 48-96 hours after online publication and is updated daily on week days.
Initial download of the metrics may take a while.