Fig. B.1.
Download original image
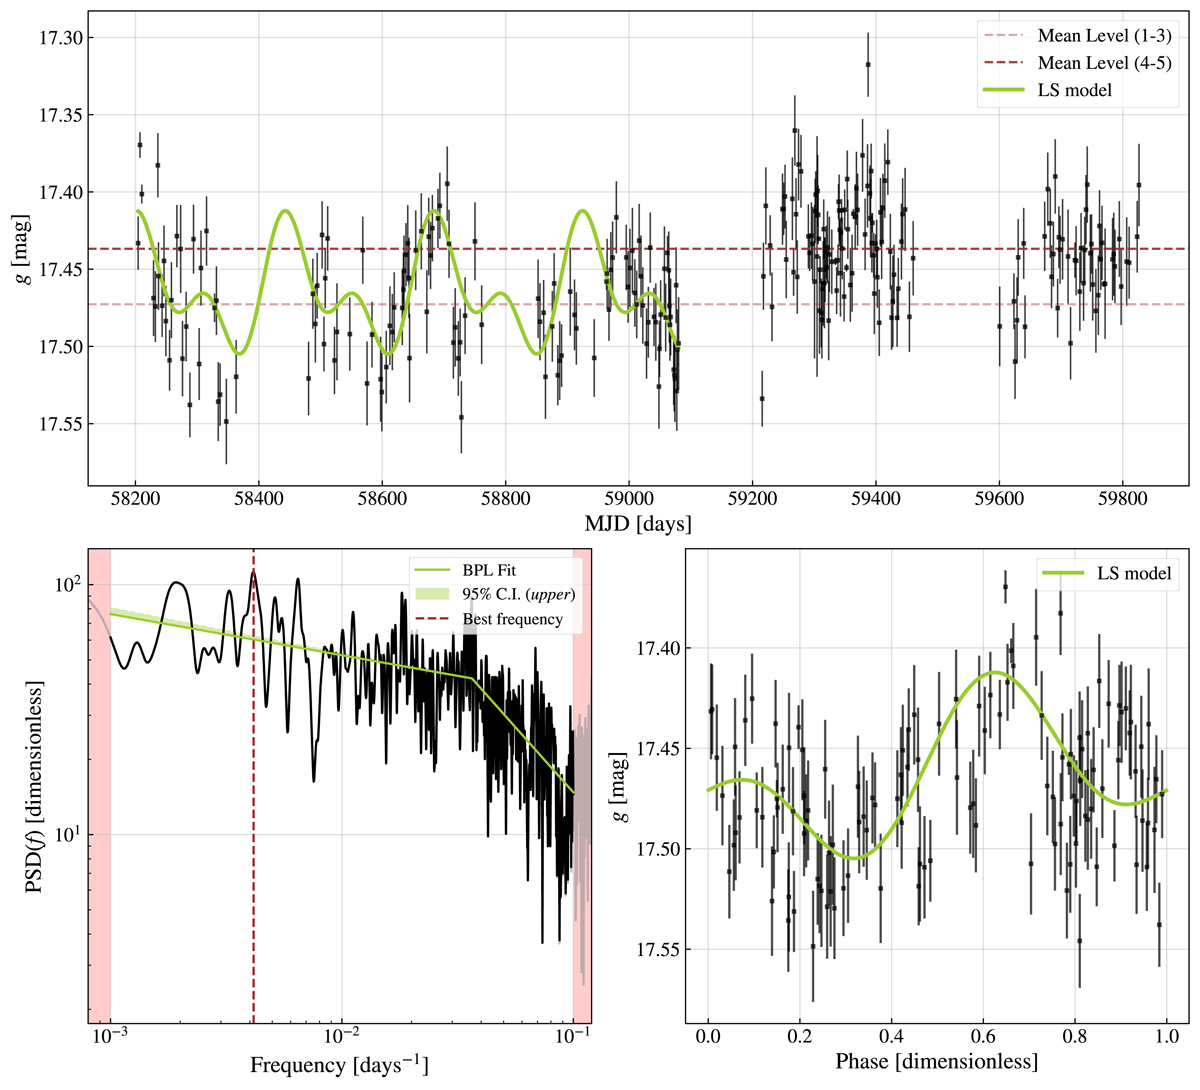
LSP analysis. Top: Detrended light curve of NED02 galaxy in g-band (black dots). The green line represents the best-fitted LS model with two Fourier terms on the first three cycles of observations. The dashed lines are the mean levels of the first three (light red) and the last two (dark red) cycles. Bottom left: LSP. The solid black line represents the PSD, the light green line is the BPL best fit (a break frequency of fbreak = 0.036 ± 0.001 days−1, low-frequency slope of α1 = 0.164 ± 0.007, and high-frequency slope of α2 = 1.04 ± 0.03), the light shaded green region is the 95% upper limit of the C.I., and the light-red shaded region shows the frequency cutoff (< 0.001 days−1 and > 0.1 days−1). The vertical dark red dashed line shows the highest peak above the 95% upper limit, corresponding to a frequency of ∼0.004 days−1. The PSD is dimensionless because the uncertainties were specified within the LombScargle/astropy implementation. Bottom right: Phase-folded light curve (black dots) for the first three cycles of observations, with the best-fit LS model (solid green line). The folding period is 240.9 days.
Current usage metrics show cumulative count of Article Views (full-text article views including HTML views, PDF and ePub downloads, according to the available data) and Abstracts Views on Vision4Press platform.
Data correspond to usage on the plateform after 2015. The current usage metrics is available 48-96 hours after online publication and is updated daily on week days.
Initial download of the metrics may take a while.