Fig. A.2.
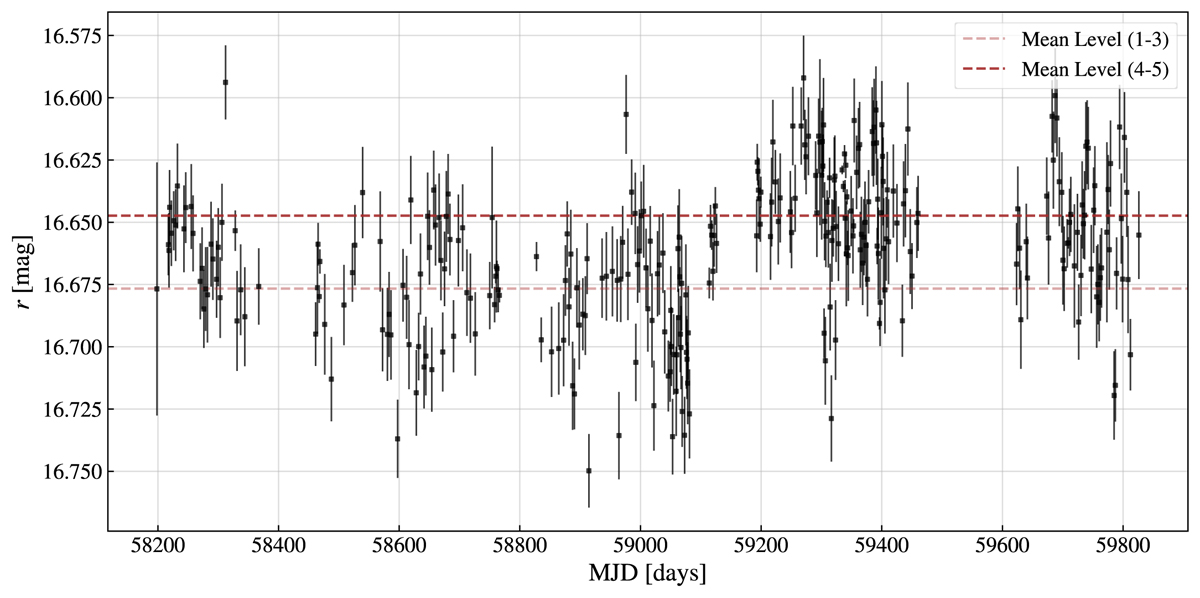
Download original image
Light curve of NED02 in r-band (black dots). The dashed lines are the mean levels of the first three (light red) and the last two (dark red) cycles. In this case, we observe low-level variability after the noise correction. For this reason, we cannot confirm without any biases whether the light curve presents periodic-like oscillations or artifacts introduced during the detrending process. Furthermore, as discussed in Subsection 5.3.2, we cannot exclude the possibility of over-subtraction of the signal amplitude, which would prevent us from analyzing the light curve correctly in this filter.
Current usage metrics show cumulative count of Article Views (full-text article views including HTML views, PDF and ePub downloads, according to the available data) and Abstracts Views on Vision4Press platform.
Data correspond to usage on the plateform after 2015. The current usage metrics is available 48-96 hours after online publication and is updated daily on week days.
Initial download of the metrics may take a while.