Fig. 12.
Download original image
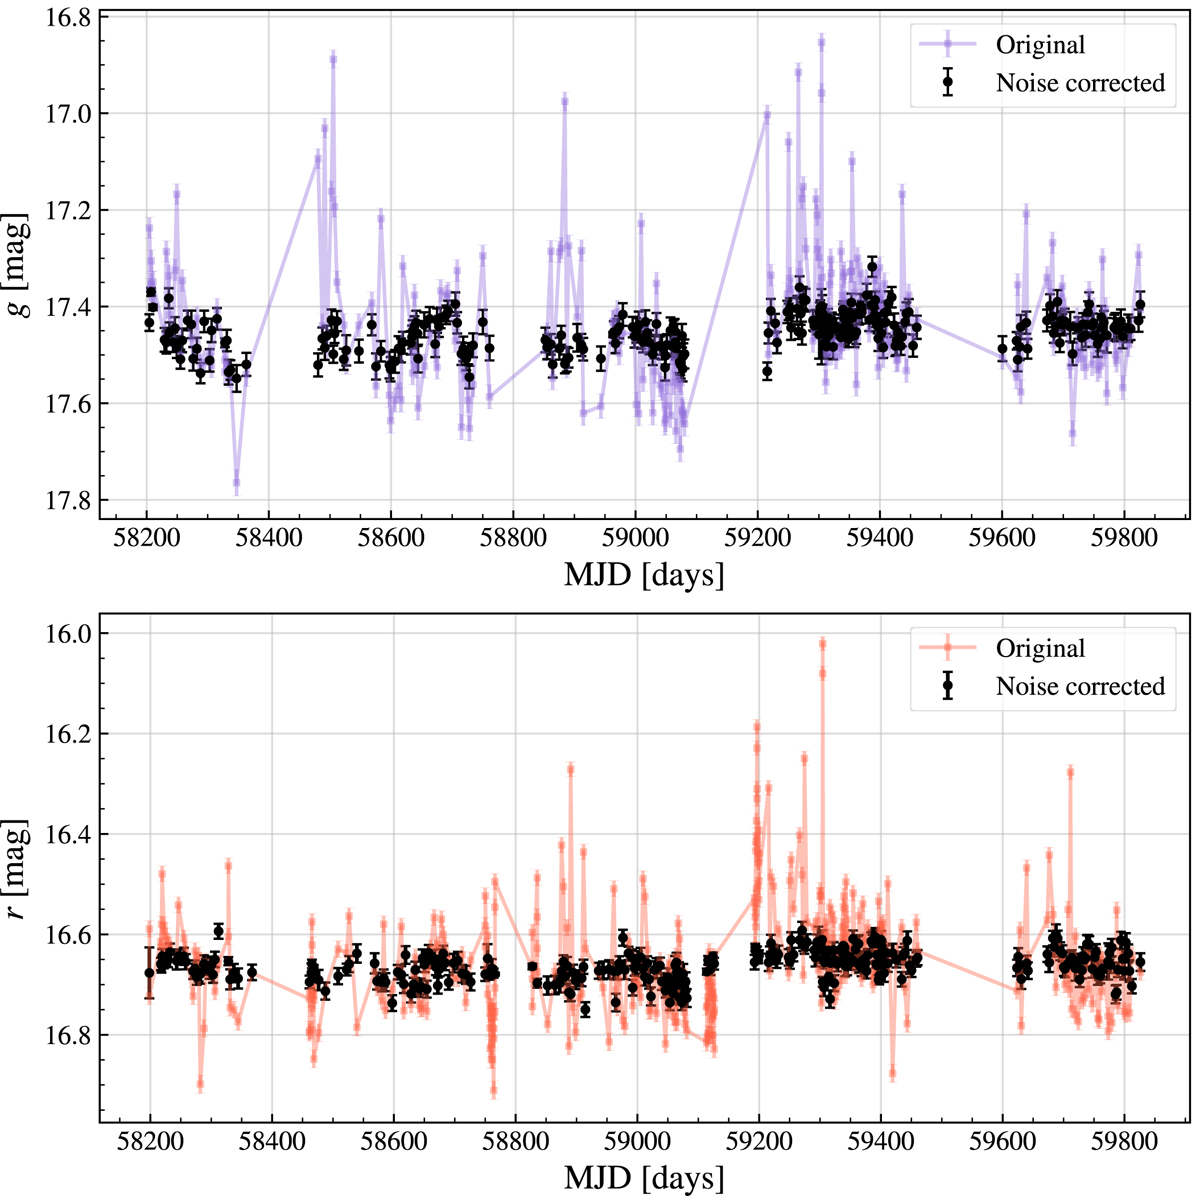
Comparison between the light curves in g (top panel) and r (bottom panel) bands of NED02 before and after the noise correction with PDT and calculation of the intranight observation mean. The purple and orange connected dots represent the original light curves in their respective filters (g and r), and the black dots with error bars represent the noise-corrected light curve.
Current usage metrics show cumulative count of Article Views (full-text article views including HTML views, PDF and ePub downloads, according to the available data) and Abstracts Views on Vision4Press platform.
Data correspond to usage on the plateform after 2015. The current usage metrics is available 48-96 hours after online publication and is updated daily on week days.
Initial download of the metrics may take a while.