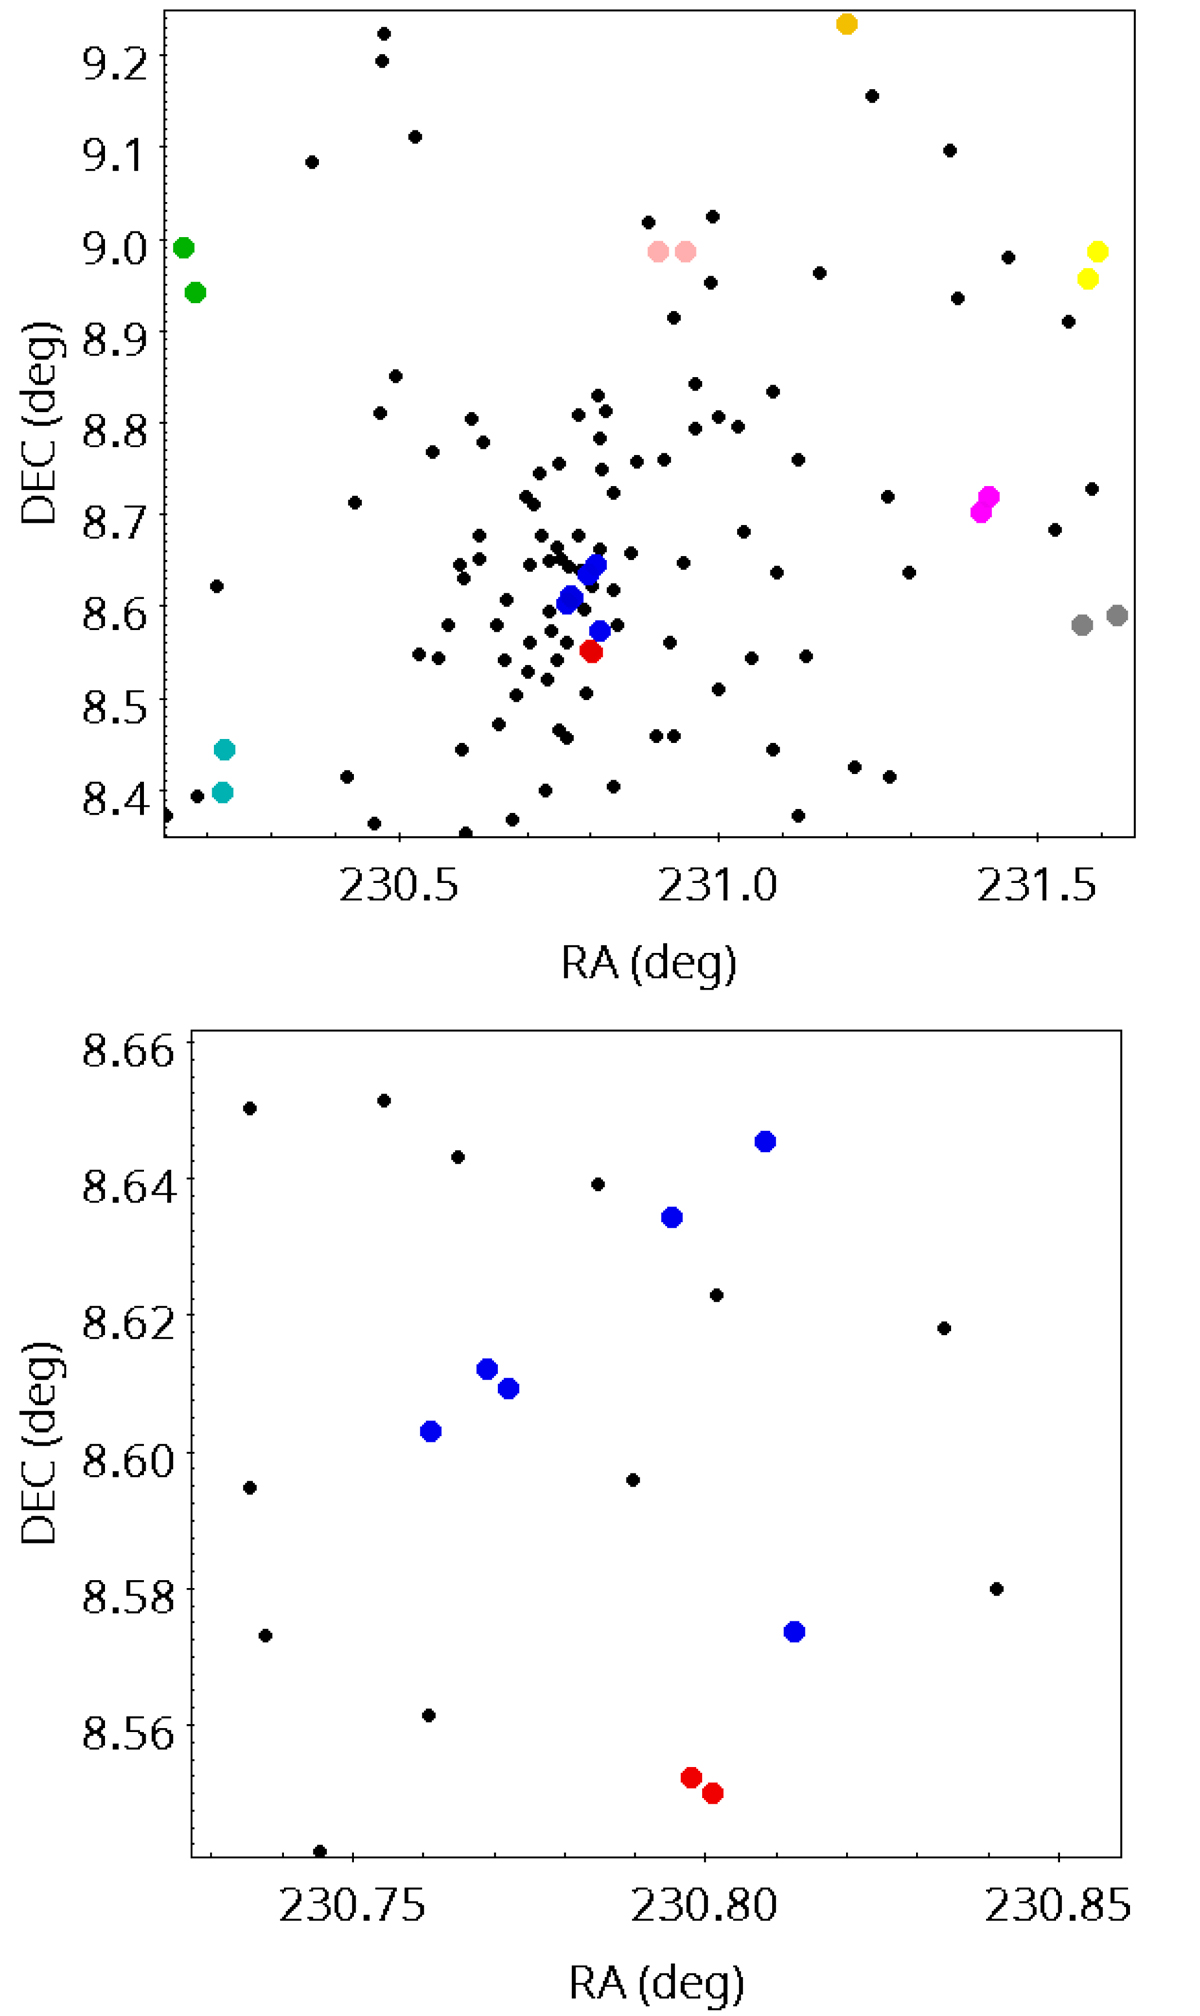
Fig. 10.
Download original image
Sky distribution (within the A2063 field of view) of the galaxies with a measured spectroscopic redshift (from NED) between 0.0285 and 0.03963 (black dots). The cluster bulk (as determined by the SG method) is shown as blue filled circles. The CGCG 077-102 pair is shown by the red filled circles. Other SG-detected pairs are shown with the other filled circles with different colors. Top: full field of view. Bottom: zoom onto the cluster center.
Current usage metrics show cumulative count of Article Views (full-text article views including HTML views, PDF and ePub downloads, according to the available data) and Abstracts Views on Vision4Press platform.
Data correspond to usage on the plateform after 2015. The current usage metrics is available 48-96 hours after online publication and is updated daily on week days.
Initial download of the metrics may take a while.