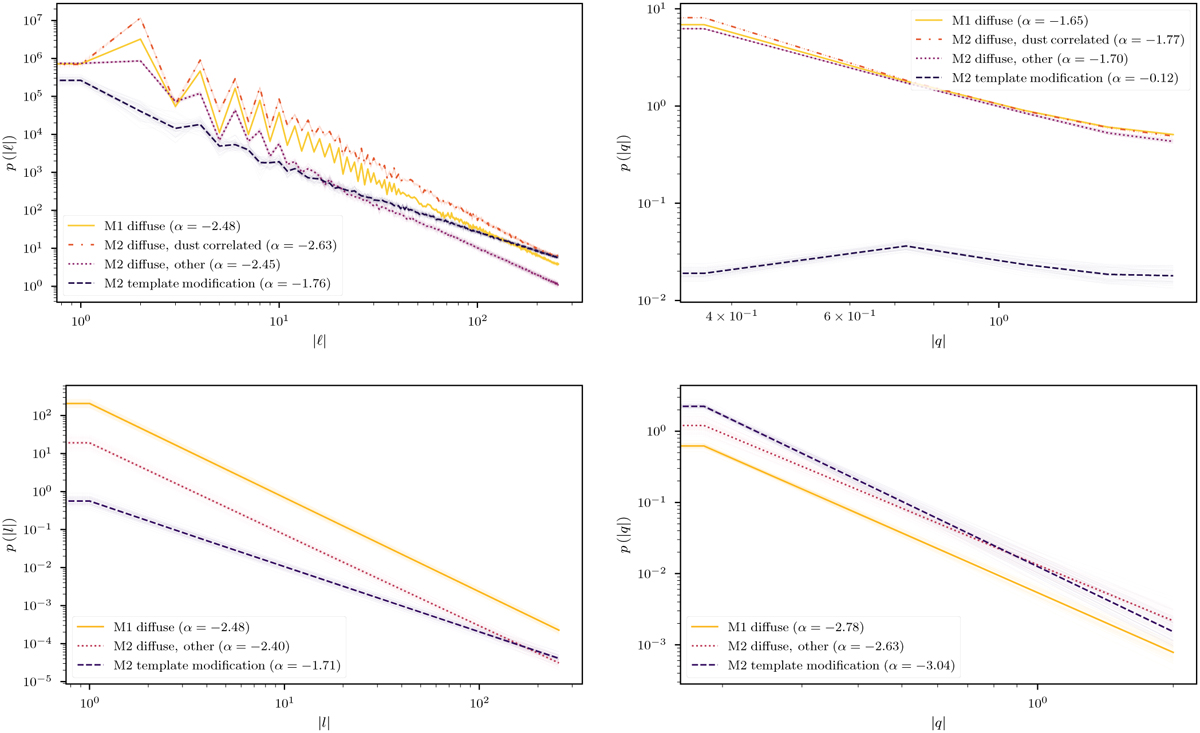
Fig. 7
Download original image
Power spectrum results of the two reconstruction runs. Top row: empirical power spectra calculated directly from the reconstructed sky components (on log10 scale). Bottom row: posterior power spectrum models of the correlated field models representing the τc. Left column: angular power spectra. Right column: energy spectrum power spectra. Bold lines show the geometric posterior sample means, while thin lines show individual posterior samples. All power spectra are plotted on log-log scale.
Current usage metrics show cumulative count of Article Views (full-text article views including HTML views, PDF and ePub downloads, according to the available data) and Abstracts Views on Vision4Press platform.
Data correspond to usage on the plateform after 2015. The current usage metrics is available 48-96 hours after online publication and is updated daily on week days.
Initial download of the metrics may take a while.