Fig. 6
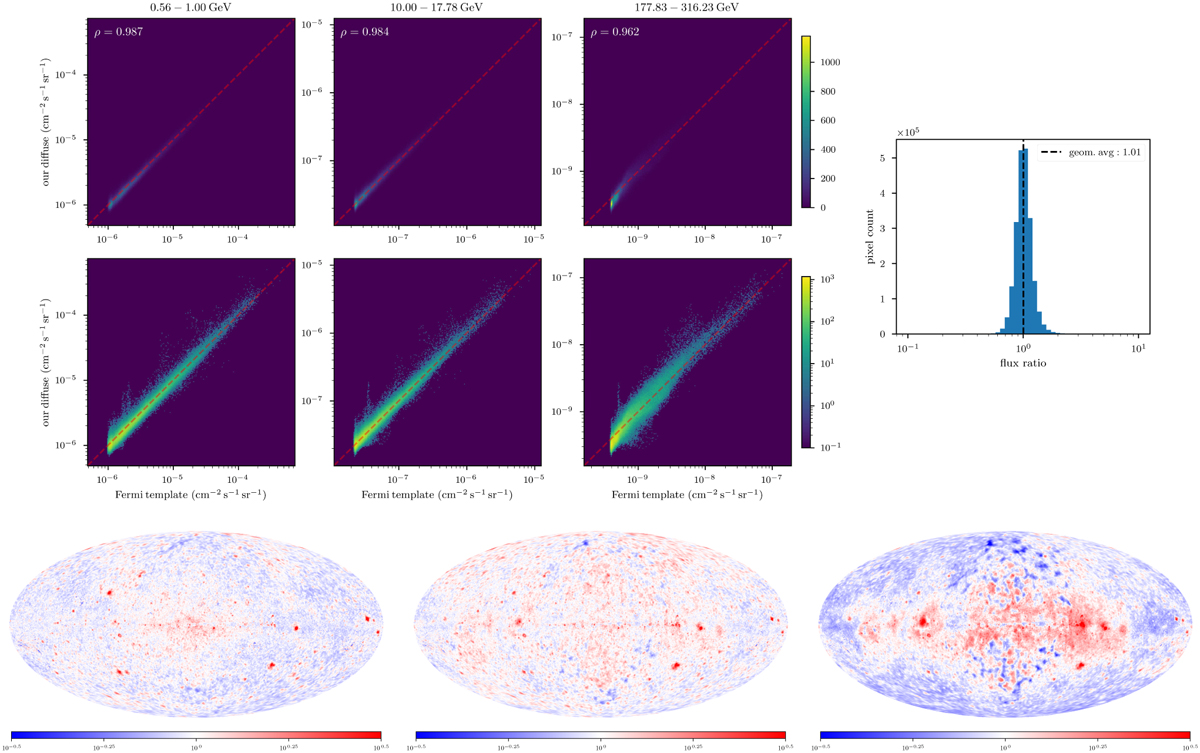
Download original image
Comparison of the M1 diffuse reconstruction with the diffuse emission templates published by the Fermi Collaboration (diffuse foreground: gll_iem_v07, isotropic background: iso_P8R3_SOURCE_V3_v1). Top left: 2D histograms of the diffuse flux found by our M1 reconstruction vs. the diffuse emission templates for the energy bins 0.56–1.00 GeV, 10.0–17.8 GeV, and 178–316 GeV. The histogram bins are logarithmically spaced in both fluxes. The top row shows the histogram counts with a linear color scale, while the bottom row shows them with a logarithmic color scale. The Pearson correlation between the template and our reconstruction on log-log scale, ρ, within the shown energy bins is given in the top column panels. The red dashed line marks perfect agreement. Top Right: histogram of flux ratios (our diffuse reconstruction divided by the corresponding voxel values given by the template) for all spatio-spectral bins. Flux ratios are binned and displayed on a logarithmic scale. Bottom row: flux ratio maps for the 0.56–1.00 GeV, 10.0–17.8 GeV, and 178–316 GeV energy bins with a logarithmic color scale. Numbers larger than 100 (= 1) indicate we reconstructed more flux than the template predicts, and vice versa.
Current usage metrics show cumulative count of Article Views (full-text article views including HTML views, PDF and ePub downloads, according to the available data) and Abstracts Views on Vision4Press platform.
Data correspond to usage on the plateform after 2015. The current usage metrics is available 48-96 hours after online publication and is updated daily on week days.
Initial download of the metrics may take a while.