Open Access
Fig. 4
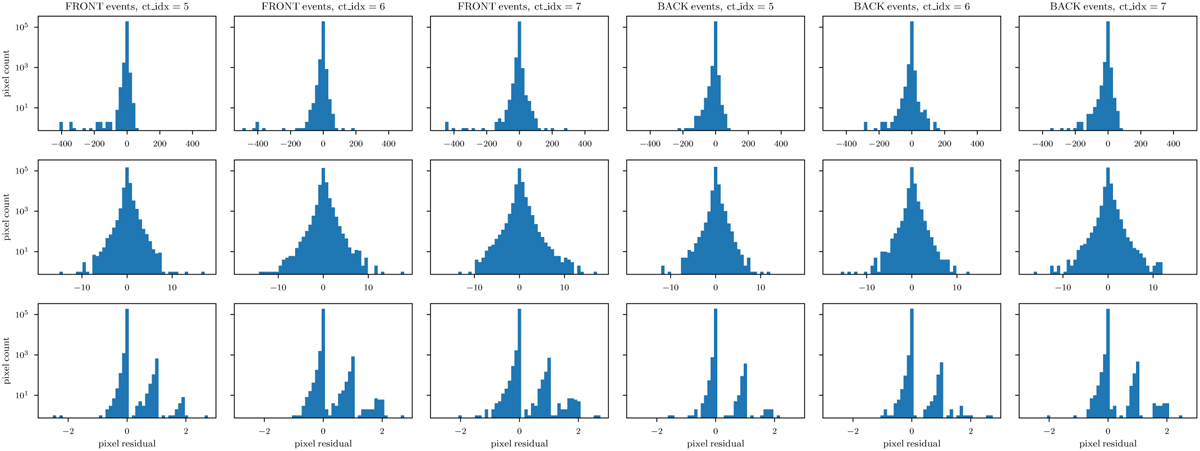
Download original image
Selected residual histograms for the M1 reconstruction. The rows show all data bins for the energies 1.00–1.78 GeV (top), 10.0–17.8 GeV (middle), and 178–316 GeV (bottom). Fig. D.2 shows the distribution of photon counts in the corresponding data bins. Pixel counts are shown on a logarithmic scale.
Current usage metrics show cumulative count of Article Views (full-text article views including HTML views, PDF and ePub downloads, according to the available data) and Abstracts Views on Vision4Press platform.
Data correspond to usage on the plateform after 2015. The current usage metrics is available 48-96 hours after online publication and is updated daily on week days.
Initial download of the metrics may take a while.