Fig. 3
Download original image
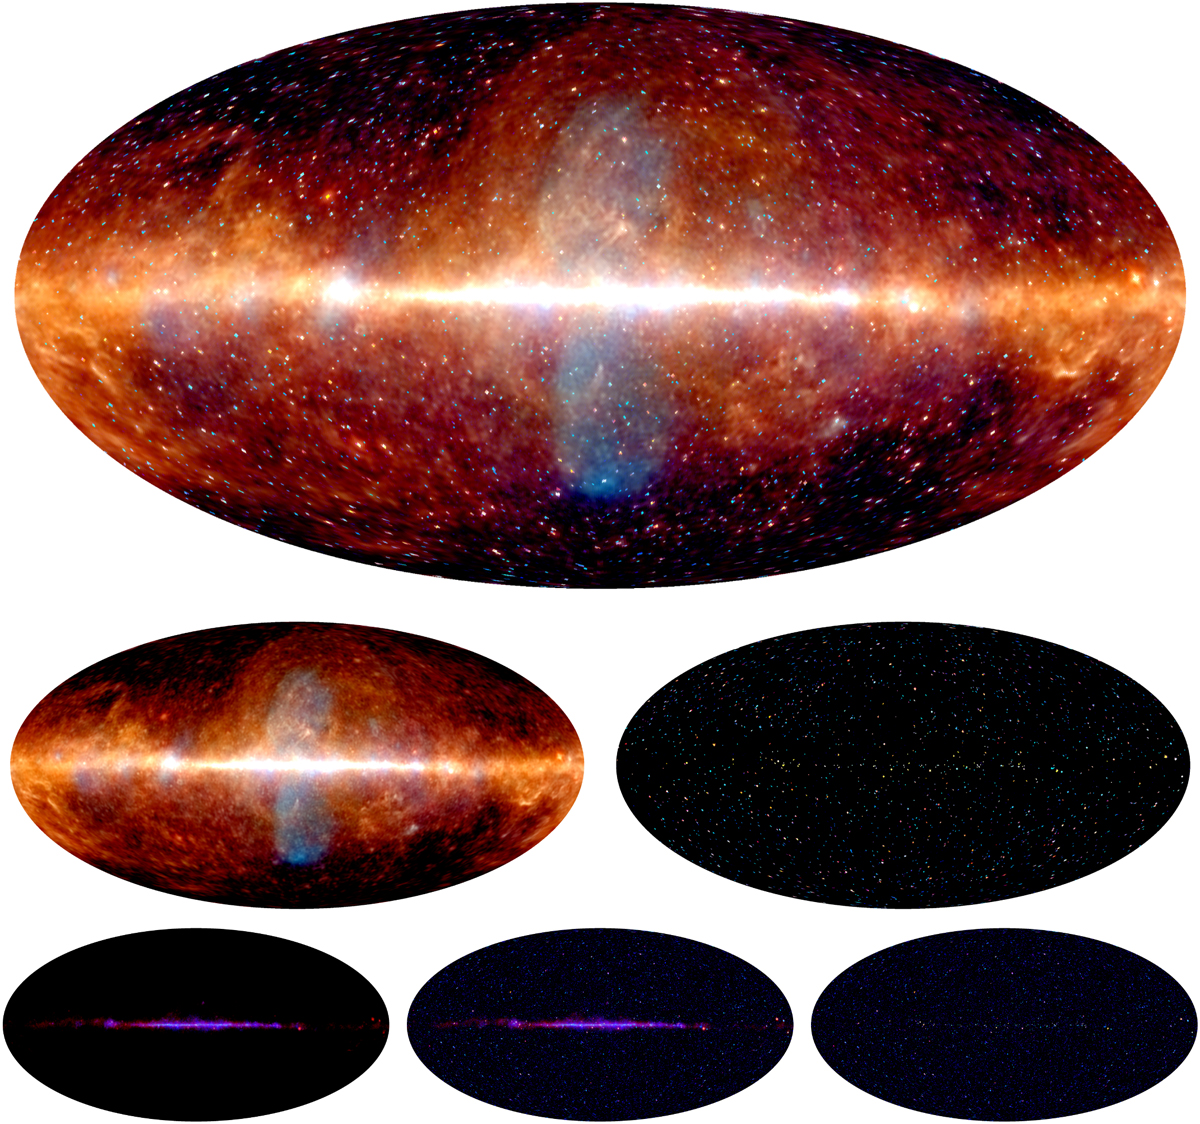
Results of the template-free reconstruction based on model M1. The figure uses the spectral domain color mapping introduced in the caption of Fig. 2 and Appendix C. It highlights spectral variations in the reconstructed skies. The color scale is provided in the bottom panel of Fig. 2. First row: reconstructed gamma-ray sky. Second row: separated diffuse emission (left) and PS sky (right). Third row: absolute uncertainties of the diffuse component (left), the full gamma-ray sky (middle), and the PS component (right). The maps follow a Mollweide projection. Single energy bin maps of the diffuse emission component are provided in Fig. D.1.
Current usage metrics show cumulative count of Article Views (full-text article views including HTML views, PDF and ePub downloads, according to the available data) and Abstracts Views on Vision4Press platform.
Data correspond to usage on the plateform after 2015. The current usage metrics is available 48-96 hours after online publication and is updated daily on week days.
Initial download of the metrics may take a while.