Open Access
Fig. D.6
Download original image
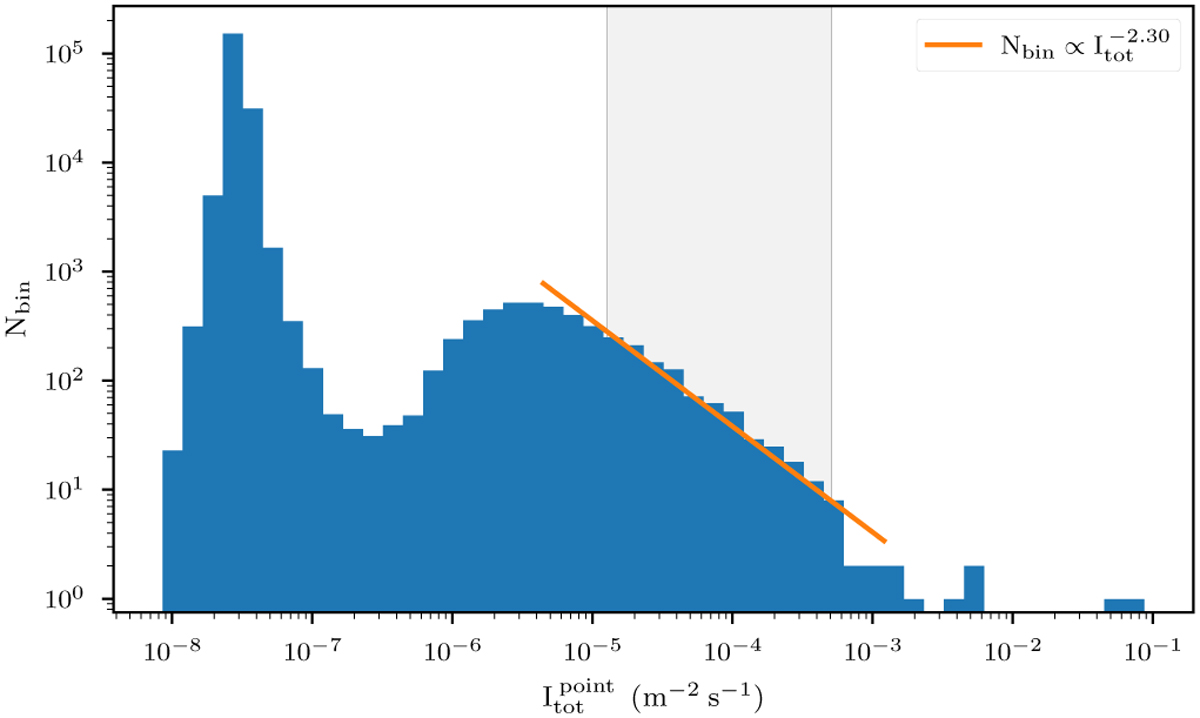
PS pixel count histogram for the M2 reconstruction on log-log scale. The orange line shows a power-law fit to the brightness distribution in the brightness range highlighted in gray. Flux values below 5 ⋅ 10−7 m−2 s−1 should be regarded as non-detections. The distribution function in this regime is prior-driven.
Current usage metrics show cumulative count of Article Views (full-text article views including HTML views, PDF and ePub downloads, according to the available data) and Abstracts Views on Vision4Press platform.
Data correspond to usage on the plateform after 2015. The current usage metrics is available 48-96 hours after online publication and is updated daily on week days.
Initial download of the metrics may take a while.