Fig. D.3
Download original image
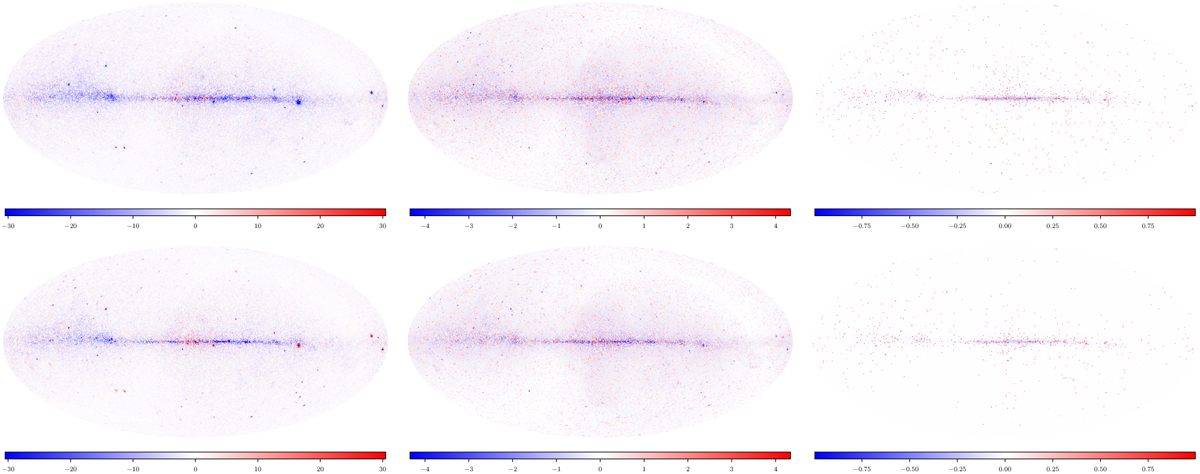
Selected residual maps for the M2 reconstruction shown for the data bin with cos(θW') ∈ (0.9,1.0], Top: FRONT events. Bottom: BACK events. Energy bins: 1.00–1.78 GeV (left), 10.0–17.8 GeV (middle), and 178–316 GeV (right). The maps are clipped to the 99.9th percentile of the residual amplitude in their respective energy bin.
Current usage metrics show cumulative count of Article Views (full-text article views including HTML views, PDF and ePub downloads, according to the available data) and Abstracts Views on Vision4Press platform.
Data correspond to usage on the plateform after 2015. The current usage metrics is available 48-96 hours after online publication and is updated daily on week days.
Initial download of the metrics may take a while.