Open Access
Fig. D.1
Download original image
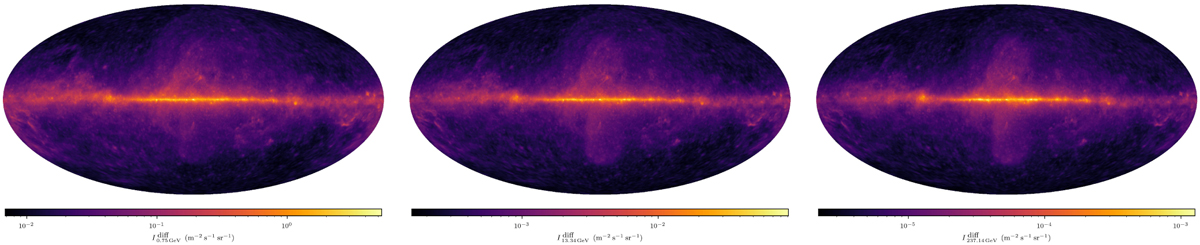
Single energy plots of the Ml diffuse reconstruction with a logarithmic color scale. Energy bins: 0.56–1.00 GeV (left), 10.0–17.8 GeV (middle), and 178–316 GeV (right). All panels have individual brightness scales and visualize the full dynamic range of their respective maps.
Current usage metrics show cumulative count of Article Views (full-text article views including HTML views, PDF and ePub downloads, according to the available data) and Abstracts Views on Vision4Press platform.
Data correspond to usage on the plateform after 2015. The current usage metrics is available 48-96 hours after online publication and is updated daily on week days.
Initial download of the metrics may take a while.