Fig. B.2
Download original image
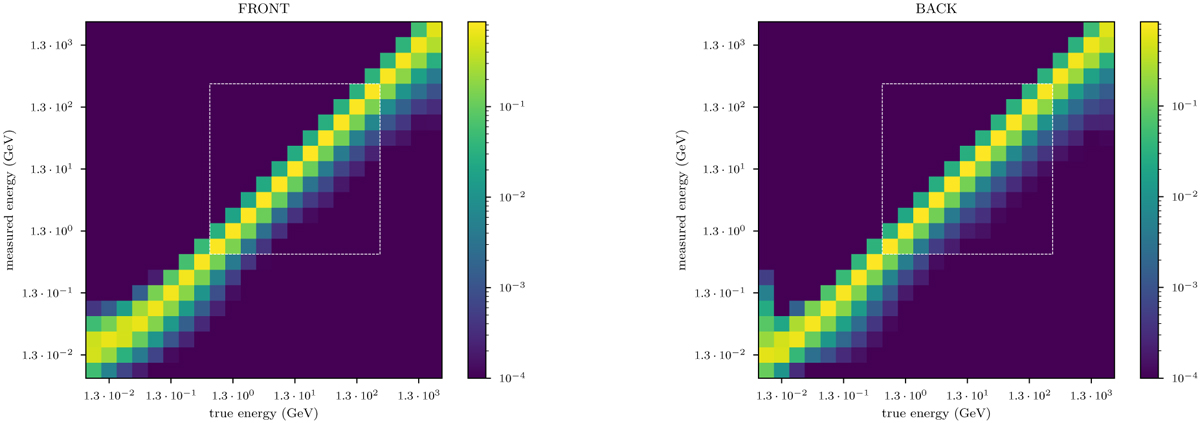
Energy dispersion matrices of the cos(θ) ∈ (0.9, 1.0] incidence direction bin for FRONT and BACK events. True and measured energies are shown on logarithmic scales. The figure shows how flux from each true energy is distributed to the observed energy bins by the measurement process and has a logarithmic color scale. The white rectangle marks the EDF matrix entries used in this work, which were selected based on the studied energy range.
Current usage metrics show cumulative count of Article Views (full-text article views including HTML views, PDF and ePub downloads, according to the available data) and Abstracts Views on Vision4Press platform.
Data correspond to usage on the plateform after 2015. The current usage metrics is available 48-96 hours after online publication and is updated daily on week days.
Initial download of the metrics may take a while.