Fig. 20
Download original image
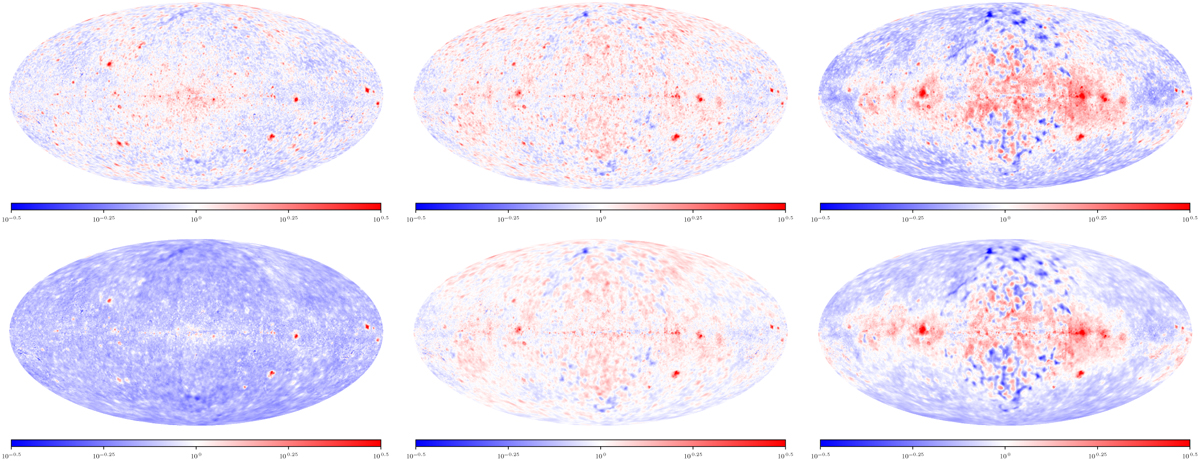
Ratio maps of our diffuse emission reconstructions and the Fermi diffuse and isotropic emission templates for the M1 (top row) and M2 (bottom row) reconstructions. The maps show our diffuse reconstructions divided by the values predicted by the Fermi templates in selected energy bins on a logarithmic color scale. Numbers larger than 100 indicate we have reconstructed more flux than the template predicts, and vice versa. Energy bins: 0.56–1.00 GeV (left), 10.0–17.8 GeV (middle), and 178–316 GeV (right).
Current usage metrics show cumulative count of Article Views (full-text article views including HTML views, PDF and ePub downloads, according to the available data) and Abstracts Views on Vision4Press platform.
Data correspond to usage on the plateform after 2015. The current usage metrics is available 48-96 hours after online publication and is updated daily on week days.
Initial download of the metrics may take a while.