Fig. 2
Download original image
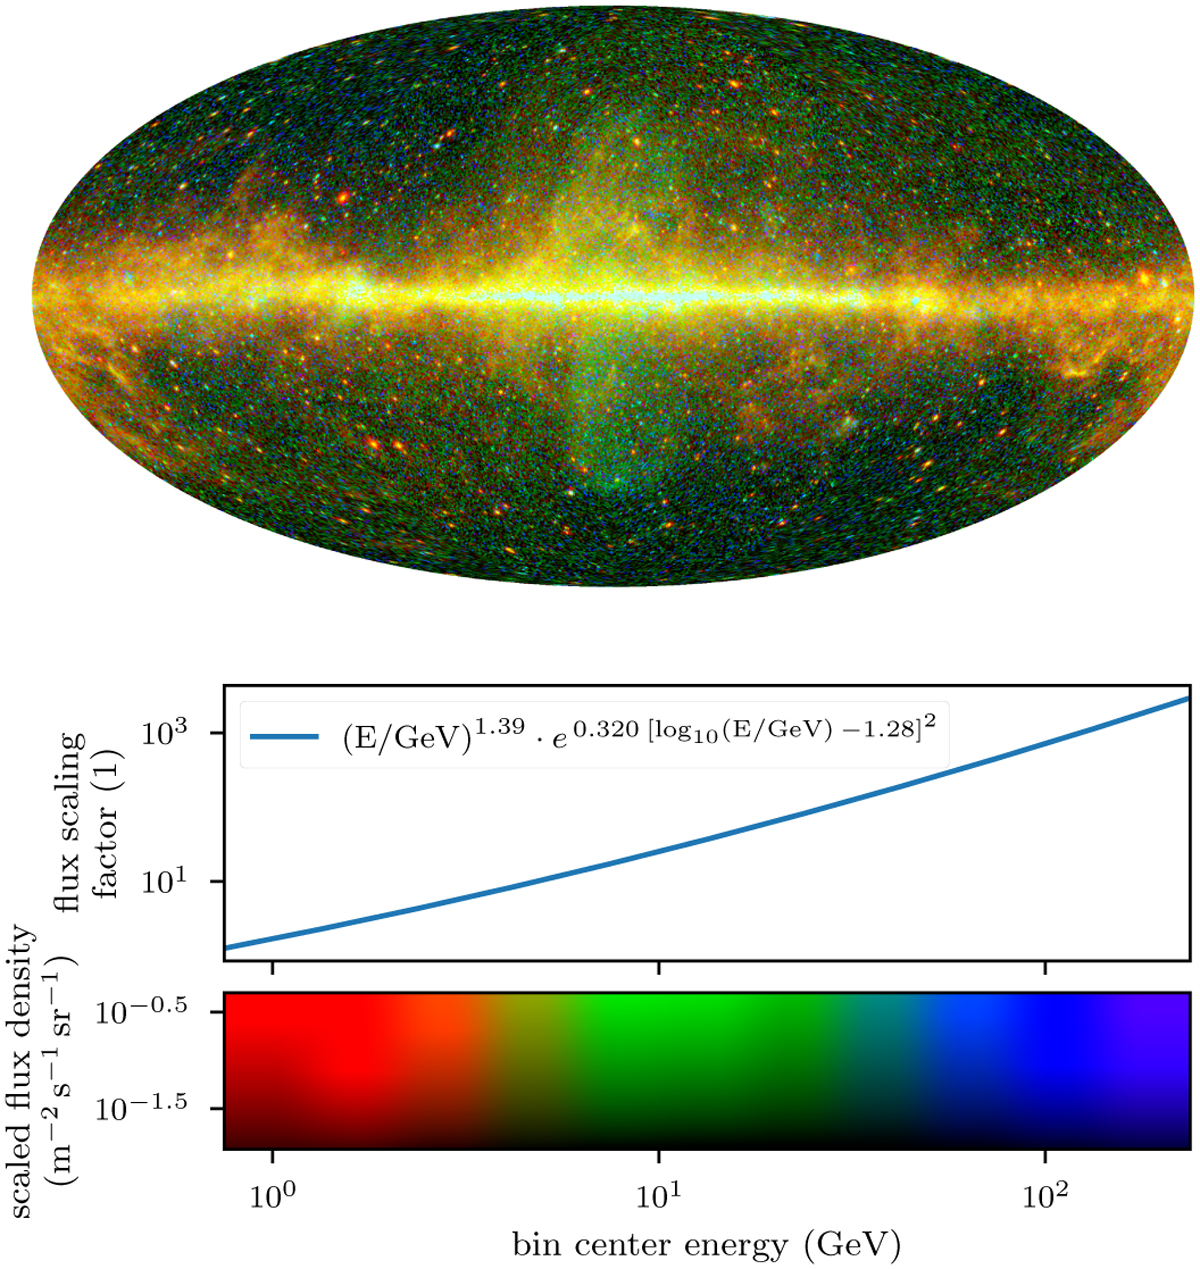
Introduction to the spatio-spectral plotting and corresponding data plot. Top: exposure- and effective-area-corrected photon count observed by the Fermi LAT in the 1–316 GeV range within the selected time frame. The photon energies are color coded with red for the lowest and blue for the highest energies. To compensate for the flux intensity change within the shown energy range, we scaled the fluxes with an energy-dependent factor before plotting. This presentation is optimized to show spectral variations. Appendix C details the employed processing steps. For reading flux values at specific energies, the reader is referred to the public release of data products at the Zenodo data repository linked in the title footnote. This and all further sky maps are based on the HEALPix pixelization (Gorski et al. 2005) with an nside of 128 and employ the Mollweide projection. Middle: energy-dependent flux scaling factor used for the spatio-spectral plotting. Bottom: mapping of photon energies and scaled flux densities to perceived colors used in the spatio-spectral plotting.
Current usage metrics show cumulative count of Article Views (full-text article views including HTML views, PDF and ePub downloads, according to the available data) and Abstracts Views on Vision4Press platform.
Data correspond to usage on the plateform after 2015. The current usage metrics is available 48-96 hours after online publication and is updated daily on week days.
Initial download of the metrics may take a while.