Fig. 15
Download original image
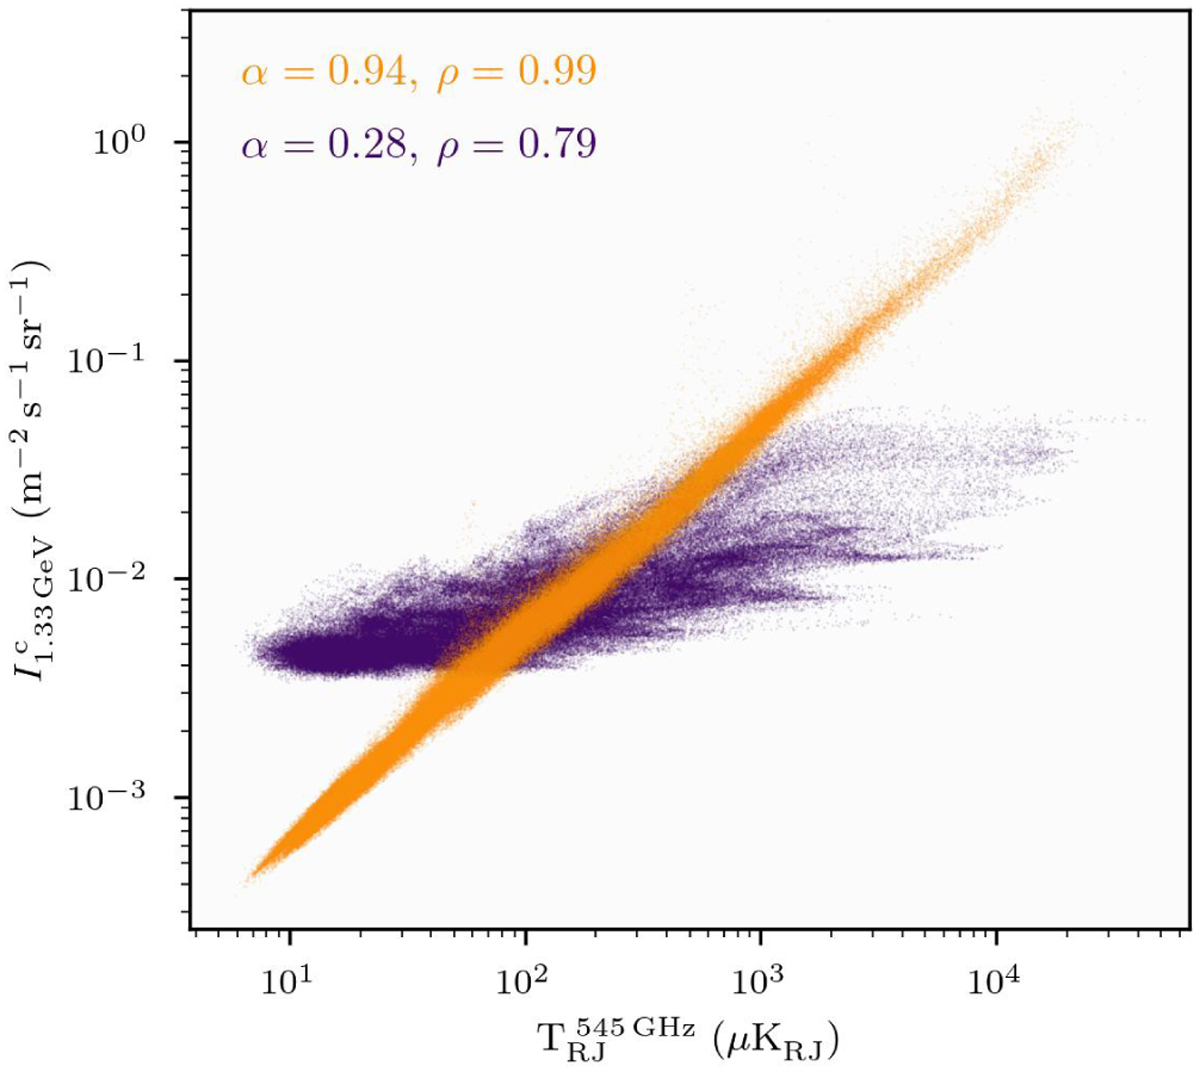
Scatter plot of the M2 diffuse flux density values in the 1.00-1.77 GeV energy bin against the Planck 545 GHz thermal dust emission map values. Each pixel is represented by a dot, with the x-axis showing the brightness temperature ![]() measured by Planck for this pixel and the y-axis showing the corresponding flux density value of our reconstruction. Both axes have a logarithmic scale. The points for the dust template informed diffuse component Idust are shown in orange, while the points for the a priori dust-independent diffuse component Ind are shown in purple. The text in the upper left corner shows the slope of a linear fit to the dots, α, and the Pearson correlation coefficient between the thermal dust map and our reconstructions on log-log scale, ρ.
measured by Planck for this pixel and the y-axis showing the corresponding flux density value of our reconstruction. Both axes have a logarithmic scale. The points for the dust template informed diffuse component Idust are shown in orange, while the points for the a priori dust-independent diffuse component Ind are shown in purple. The text in the upper left corner shows the slope of a linear fit to the dots, α, and the Pearson correlation coefficient between the thermal dust map and our reconstructions on log-log scale, ρ.
Current usage metrics show cumulative count of Article Views (full-text article views including HTML views, PDF and ePub downloads, according to the available data) and Abstracts Views on Vision4Press platform.
Data correspond to usage on the plateform after 2015. The current usage metrics is available 48-96 hours after online publication and is updated daily on week days.
Initial download of the metrics may take a while.