Fig. 11
Download original image
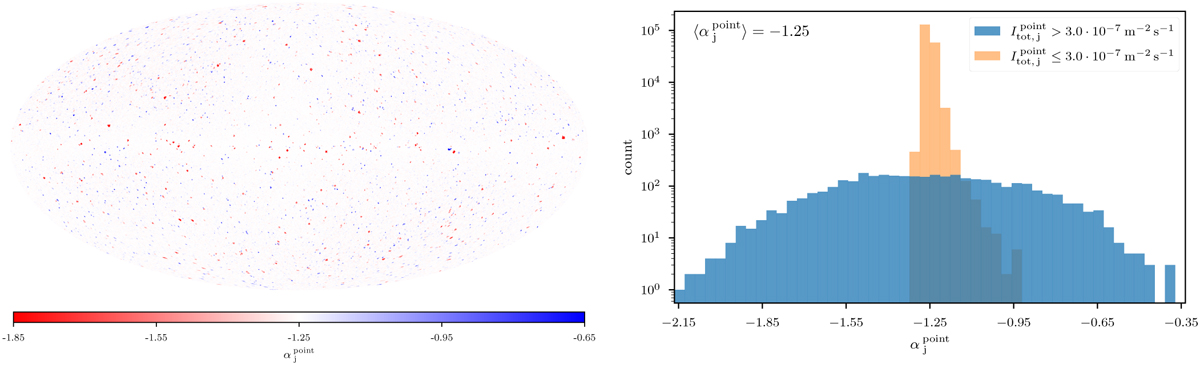
M1 PS spectral index ![]() posterior means. We note that the spectral indices have an offset of +1 introduced by the logarithmic binning of the energy dimension (see Eq. (4)). Left: map of spectral indices recovered for the PS pixels. The color scale is centered on the prior mean, −1.25, and ranges from two prior standard deviations above to two standard deviations below the prior mean. Right: histogram of posterior PS pixel spectral index means for switched on (blue) and switched off PS pixels (orange). The x-axis is centered on the prior mean, with the ticks indicating prior standard deviation sized steps from the prior mean. The y-axis shows counts on a logarithmic scale.
posterior means. We note that the spectral indices have an offset of +1 introduced by the logarithmic binning of the energy dimension (see Eq. (4)). Left: map of spectral indices recovered for the PS pixels. The color scale is centered on the prior mean, −1.25, and ranges from two prior standard deviations above to two standard deviations below the prior mean. Right: histogram of posterior PS pixel spectral index means for switched on (blue) and switched off PS pixels (orange). The x-axis is centered on the prior mean, with the ticks indicating prior standard deviation sized steps from the prior mean. The y-axis shows counts on a logarithmic scale.
Current usage metrics show cumulative count of Article Views (full-text article views including HTML views, PDF and ePub downloads, according to the available data) and Abstracts Views on Vision4Press platform.
Data correspond to usage on the plateform after 2015. The current usage metrics is available 48-96 hours after online publication and is updated daily on week days.
Initial download of the metrics may take a while.