Open Access
Fig. A.1.
Download original image
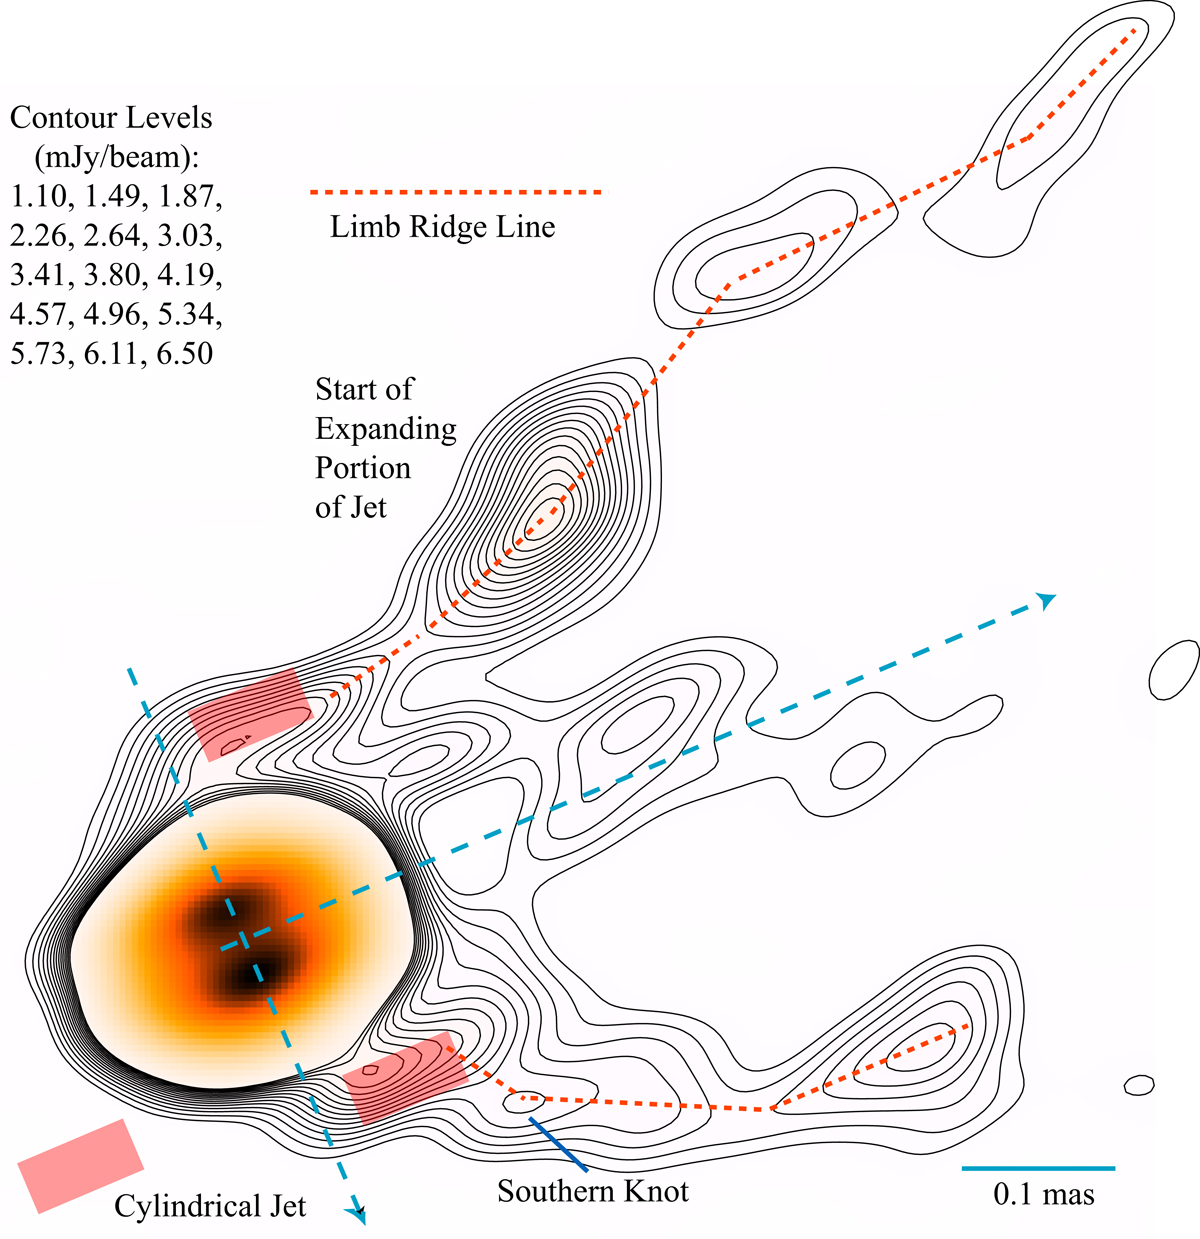
Profile of the jet limbs from z = 25μas to z > 500μas. The contours are the same as in Fig. 1 but the field of view is wider. The dashed red limb ridge line is a linear piece-wise approximation of the peak intensity. The pink rectangles represent the cylindrical model described in the text.
Current usage metrics show cumulative count of Article Views (full-text article views including HTML views, PDF and ePub downloads, according to the available data) and Abstracts Views on Vision4Press platform.
Data correspond to usage on the plateform after 2015. The current usage metrics is available 48-96 hours after online publication and is updated daily on week days.
Initial download of the metrics may take a while.