Fig. 2.
Download original image
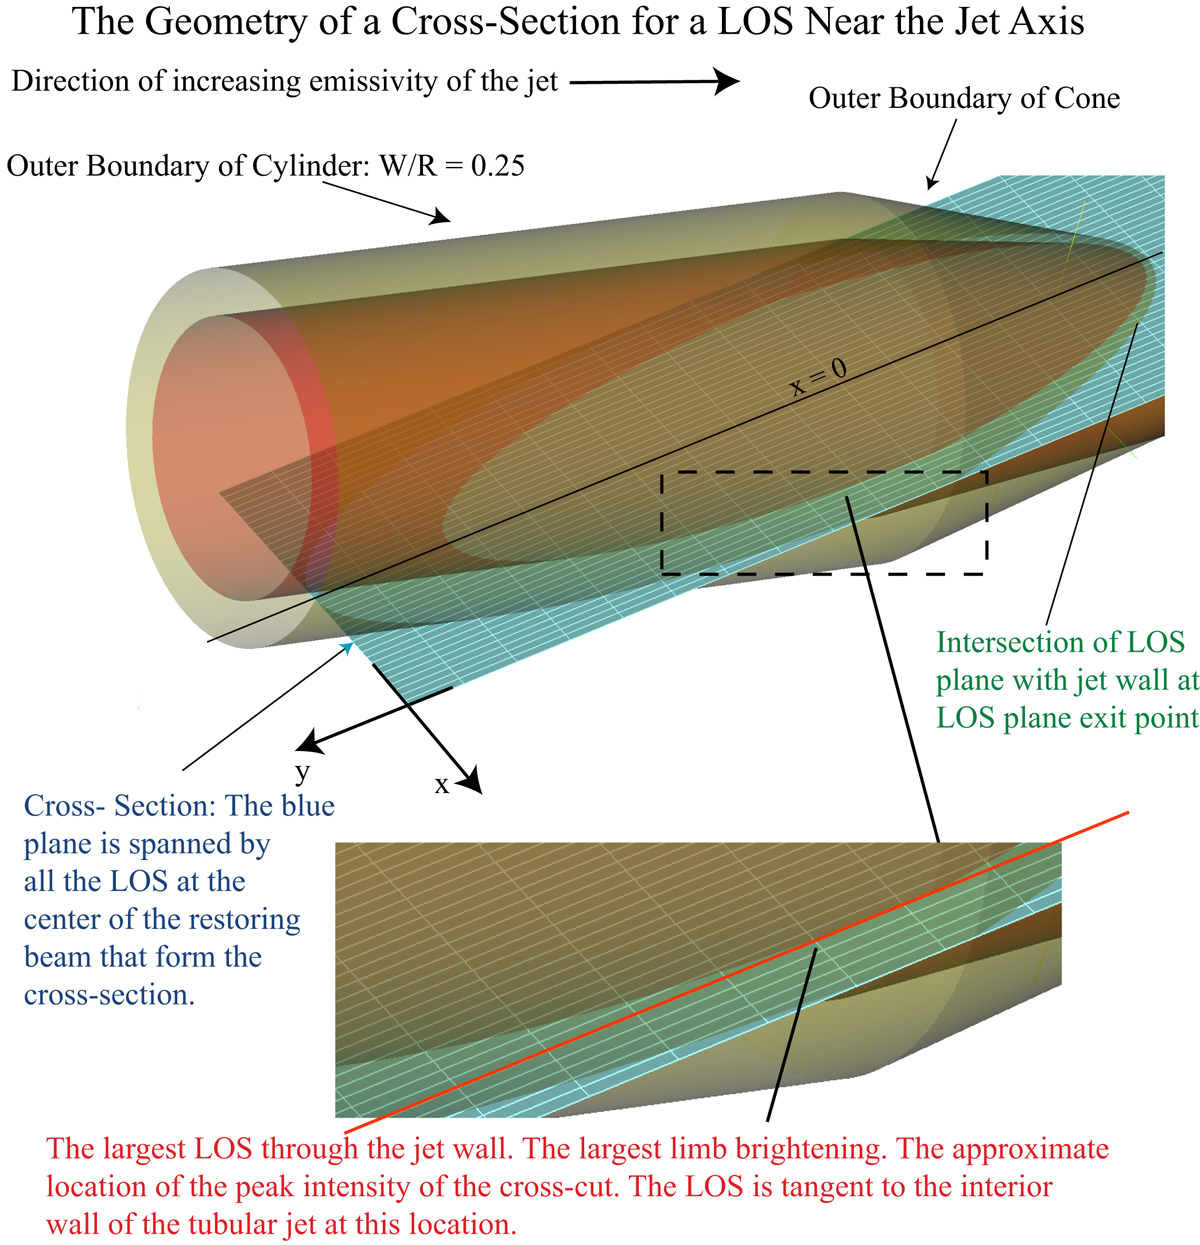
Blue (x, y) plane foliated by the set of all LOSs that constitute a cross-cut. The intersection of the plane with the tubular jet is in dark olive green. A zoomed-in view of the region of maximum limb-brightening, delimited by the dashed black rectangle, is shown at the bottom. This region has the longest LOS through the tubular jet wall (red line), as indicated by the white grid overlaid on the blue LOS plane.
Current usage metrics show cumulative count of Article Views (full-text article views including HTML views, PDF and ePub downloads, according to the available data) and Abstracts Views on Vision4Press platform.
Data correspond to usage on the plateform after 2015. The current usage metrics is available 48-96 hours after online publication and is updated daily on week days.
Initial download of the metrics may take a while.