Fig. 4.
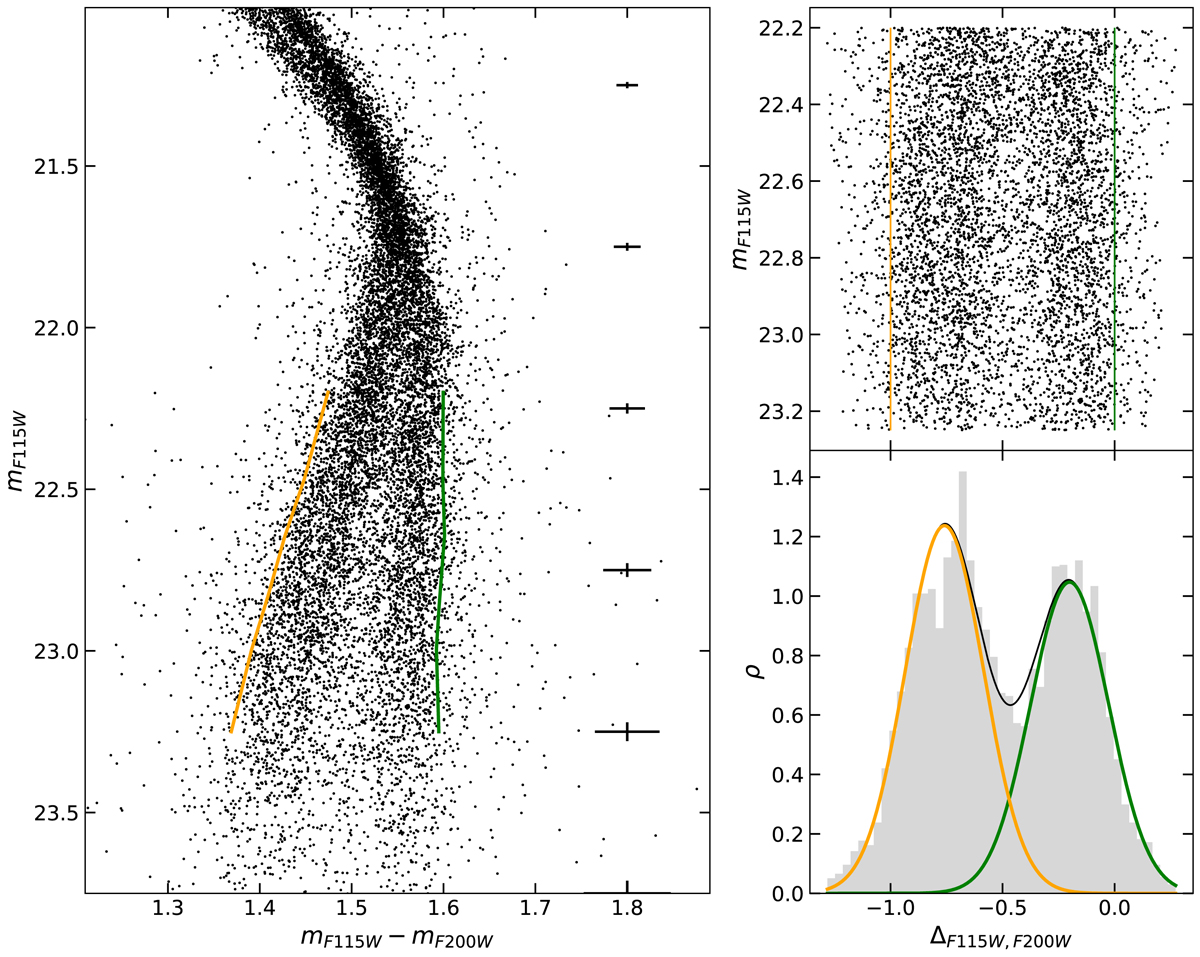
Download original image
Lower bi-modality analysis. Left-hand panel: JWST CMD of NGC 6440 zoomed on the lower main sequence. The orange and green curves are the two fiducial lines adopted to verticalize the colour distribution. The error bars on the right side on the plot represent the average photometric uncertainties. Right-hand panels: verticalized colour distribution of main sequence stars in the magnitude range 22.2 < mF115W < 23.25, shown at the top. The bottom panel shows the histogram of the same distribution. The orange and green curves display the best-fit Gaussian functions to the observed distribution, while the black one shows the sum of them.
Current usage metrics show cumulative count of Article Views (full-text article views including HTML views, PDF and ePub downloads, according to the available data) and Abstracts Views on Vision4Press platform.
Data correspond to usage on the plateform after 2015. The current usage metrics is available 48-96 hours after online publication and is updated daily on week days.
Initial download of the metrics may take a while.