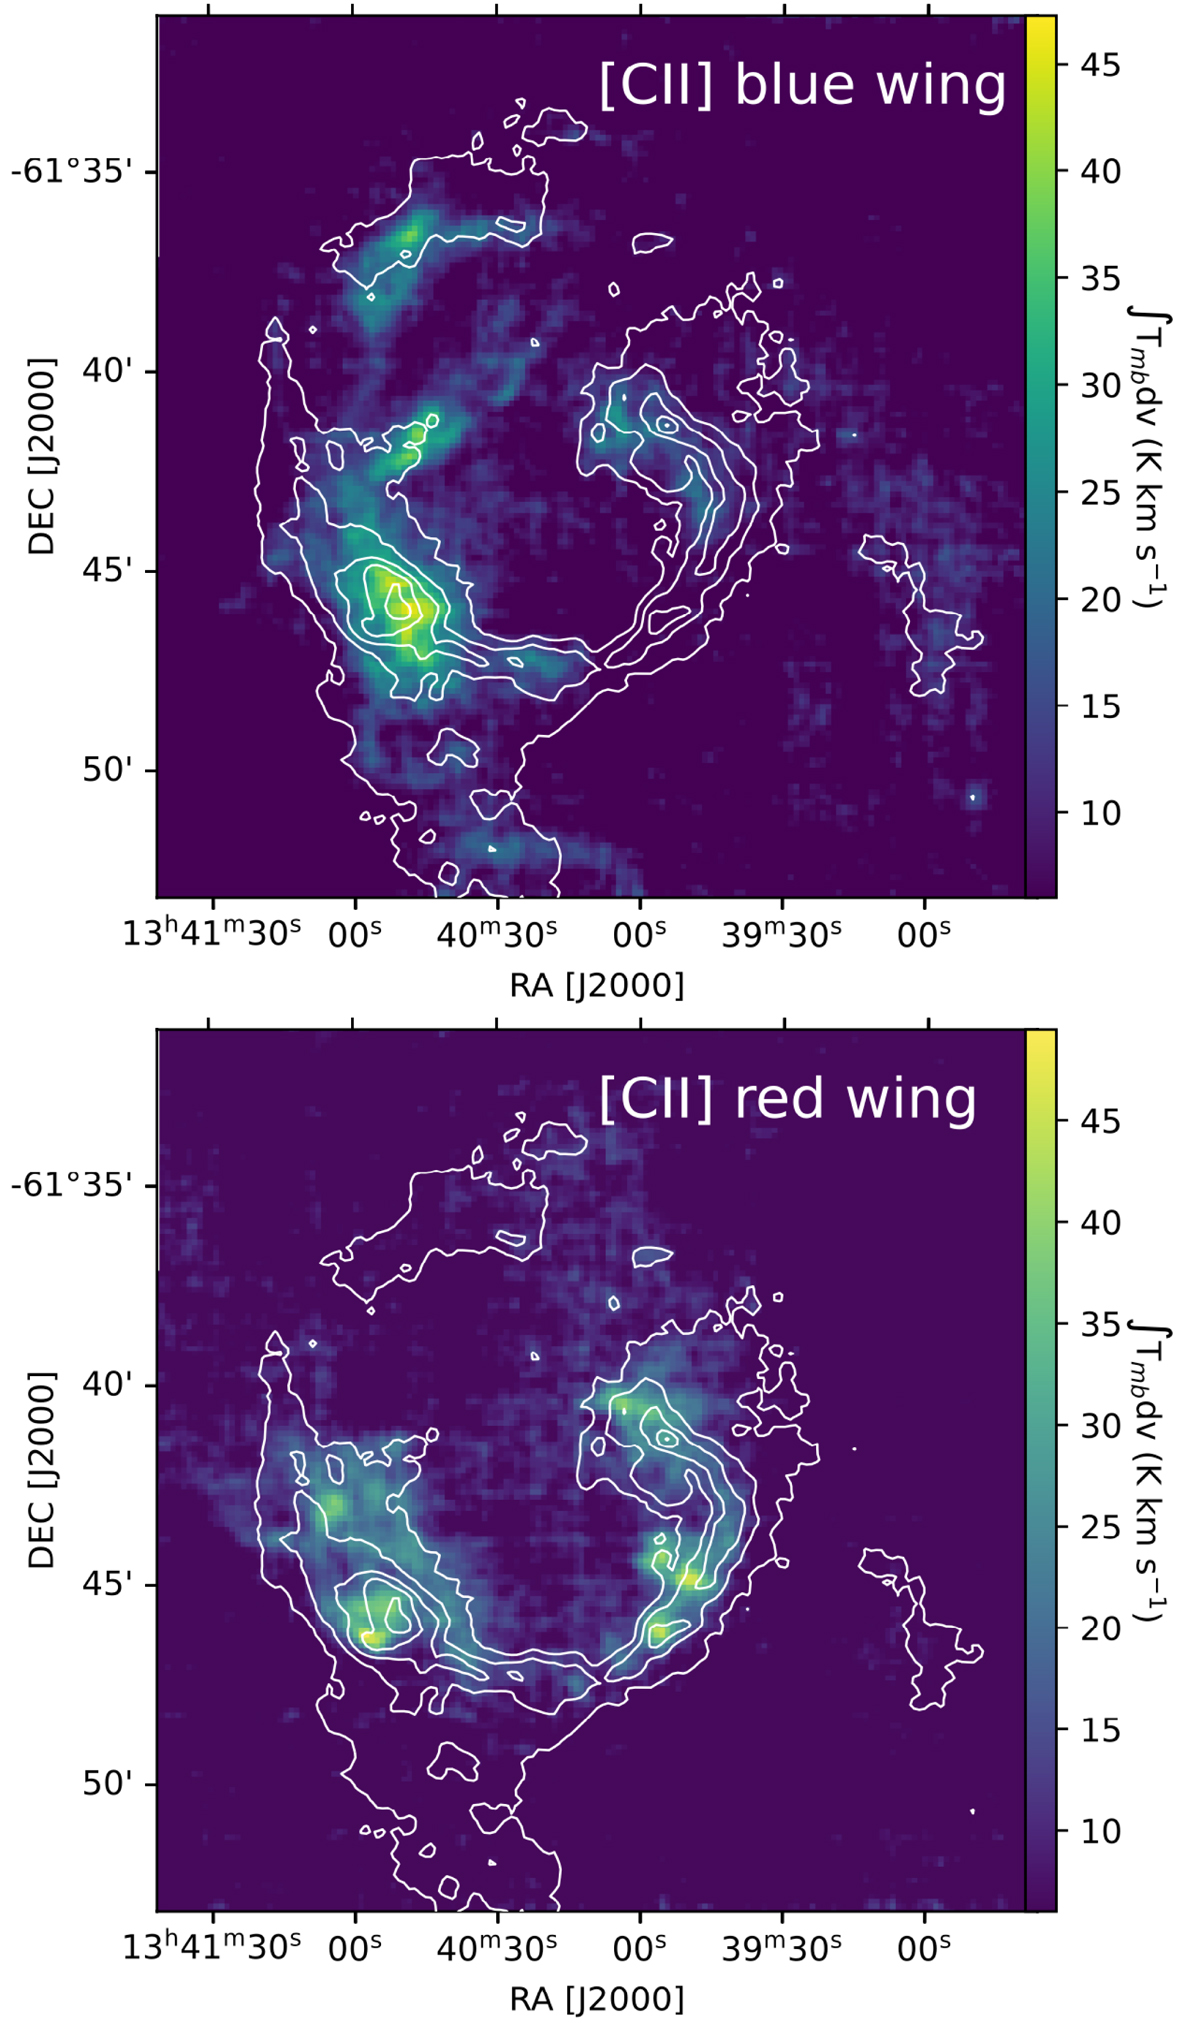
Fig. 4.
Download original image
Spatial distribution of the blue- and redshifted [C II] high-velocity gas in RCW 79. Top: Intensity map, integrated over the blueshifted high-velocity wing (i.e., −70 to −52.6 km s−1). The high-velocity gas is also observed to the south of RCW 79. The white contours indicate the total integrated [C II] emission (presented in Fig. 1) starting at 50 K km s−1 with increments of 50 K km s−1. Bottom: Same, but for the redshifted high-velocity wing (i.e., −41.4 to −25 km s−1). The high-velocity gas is observed passing through the openings of the H II region in the northeast and northwest.
Current usage metrics show cumulative count of Article Views (full-text article views including HTML views, PDF and ePub downloads, according to the available data) and Abstracts Views on Vision4Press platform.
Data correspond to usage on the plateform after 2015. The current usage metrics is available 48-96 hours after online publication and is updated daily on week days.
Initial download of the metrics may take a while.