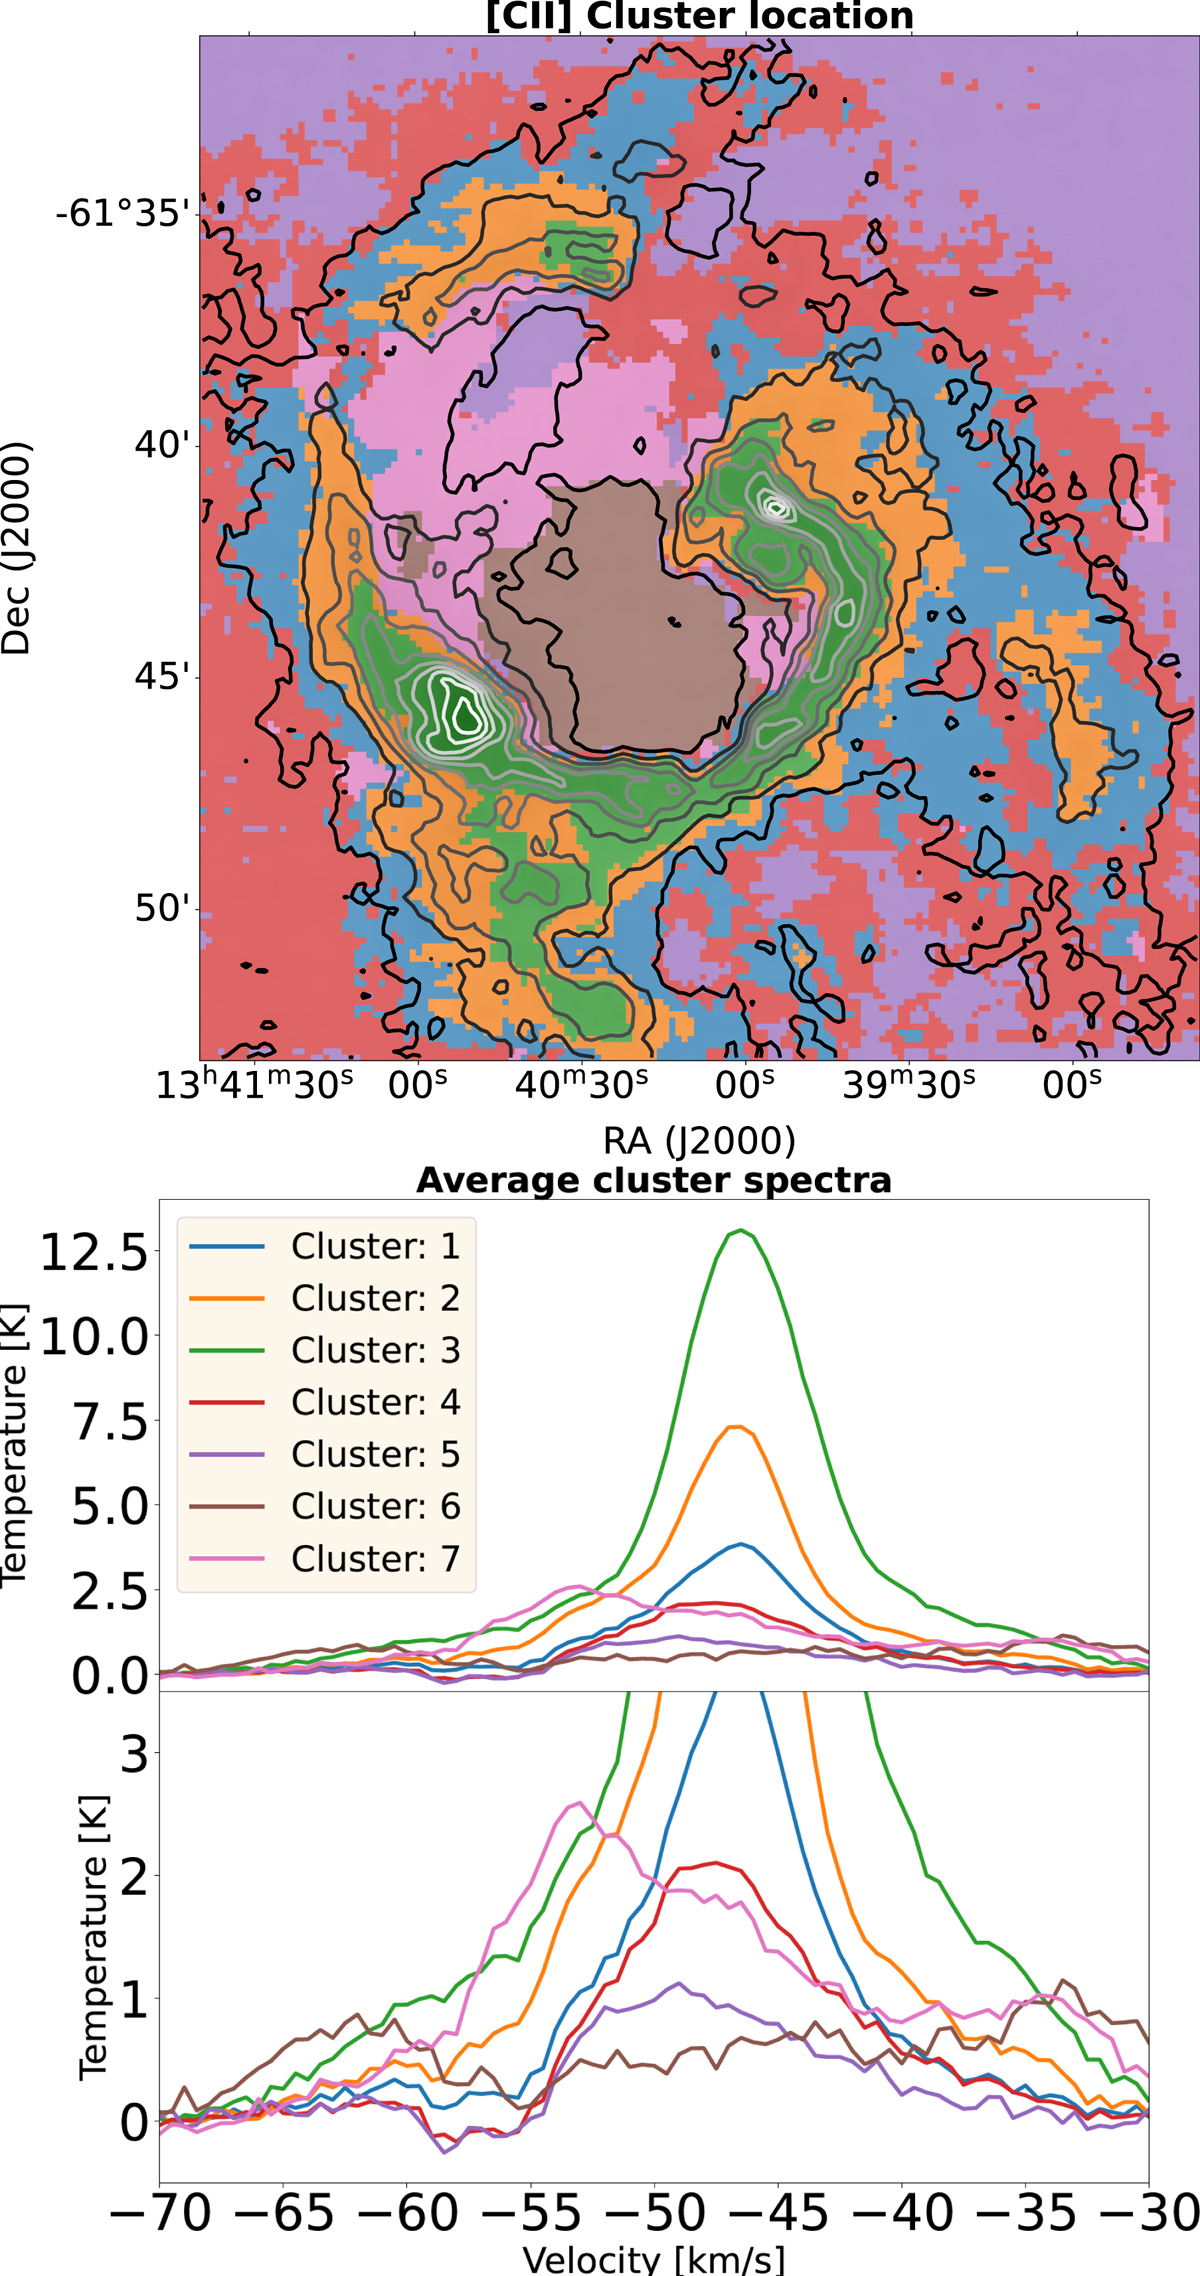
Fig. 3.
Download original image
Output of the unsupervised GMM clustering algorithm on the [C II] data of RCW 79. Top: Cluster locations in RCW 79, representing zones with similar [C II] spectral line profiles, identified with the GMM. The contours indicate the total [C II] integrated intensity, starting at 25 K km s−1 with increments of 25 K km s−1, revealing that the regions identified based on the normalized [C II] spectral morphology with the GMM are clearly correlated to spatial features identified in the intensity map of the region. Bottom: Corresponding average spectra for each cluster identified by the GMM calculations on RCW 79.
Current usage metrics show cumulative count of Article Views (full-text article views including HTML views, PDF and ePub downloads, according to the available data) and Abstracts Views on Vision4Press platform.
Data correspond to usage on the plateform after 2015. The current usage metrics is available 48-96 hours after online publication and is updated daily on week days.
Initial download of the metrics may take a while.