Fig. 1.
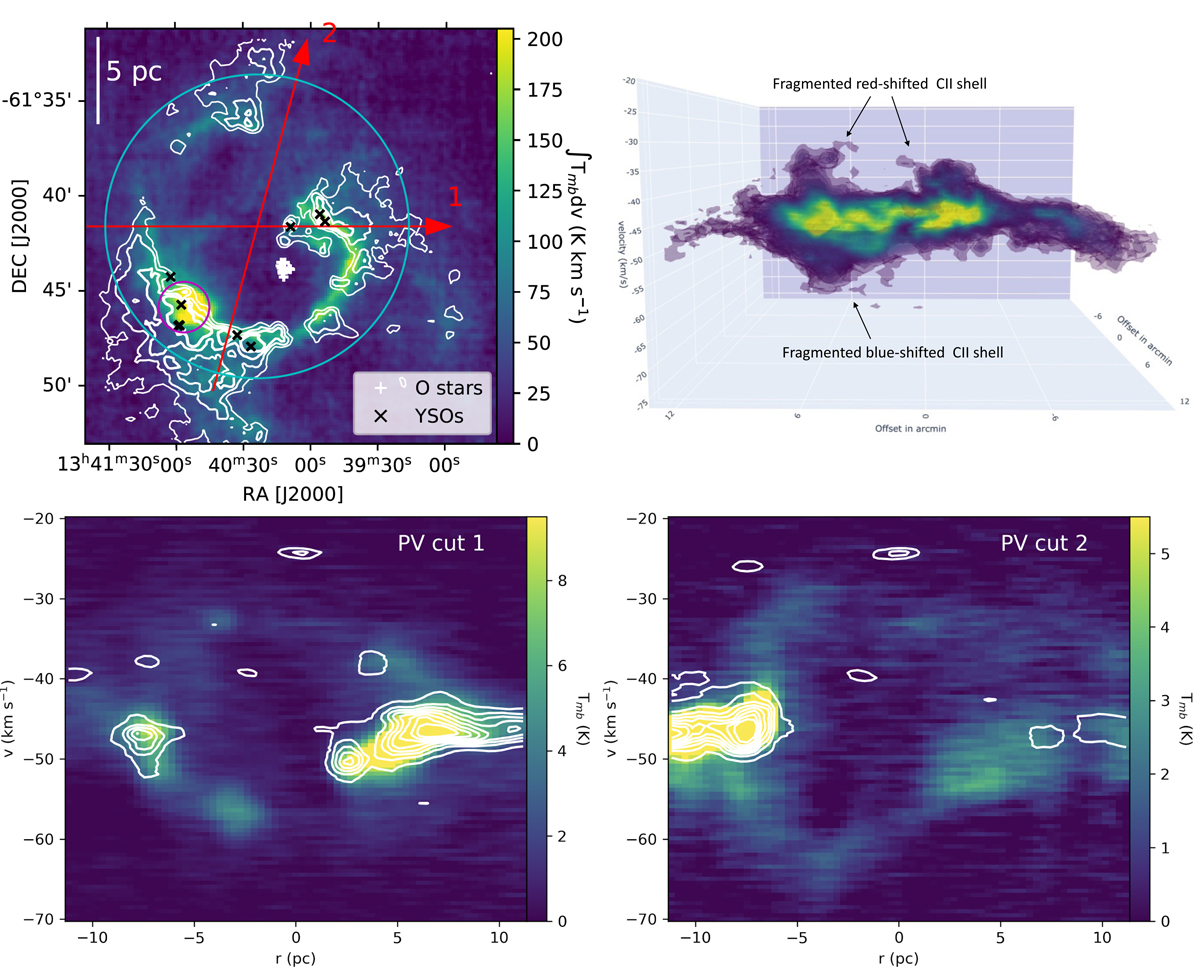
Download original image
Integrated intensity map and kinematic structure of RCW 79 in [C II]. Top left: [C II] integrated intensity map of RCW 79 between −70 and −20 km s−1 with the integrated 12CO(3–2) emission at 25, 50, 75, and 100 K km s−1 overlaid by white contours. The white plus signs and black crosses respectively give the locations of the previously identified O stars and YSOs in the region. The red arrows outline the cuts used for the PV diagrams below, with the arrow indicating a positive radius. The cyan circle delimits the region used for the average spectrum presented in Fig. 2 and the magenta circle indicates the compact H II region. Movies of PV cuts over the map are found online and at https://hera.ph1.uni-koeln.de/~nschneid/rcw79_animations.html. Top right: 2D projection of an interactive 3D isocontour plot, which is found at the same url as above. Bottom left and right: [C II] PV diagrams with the 12CO(3–2) emission indicated by white contours. Both blue- and redshifted high-velocity [C II] emission is detected. The high-velocity [C II] gas is typically found toward the edges of the H II region, and flowing out through the opening in the northwest (see PV cut 2).
Current usage metrics show cumulative count of Article Views (full-text article views including HTML views, PDF and ePub downloads, according to the available data) and Abstracts Views on Vision4Press platform.
Data correspond to usage on the plateform after 2015. The current usage metrics is available 48-96 hours after online publication and is updated daily on week days.
Initial download of the metrics may take a while.