Fig. A.1
Download original image
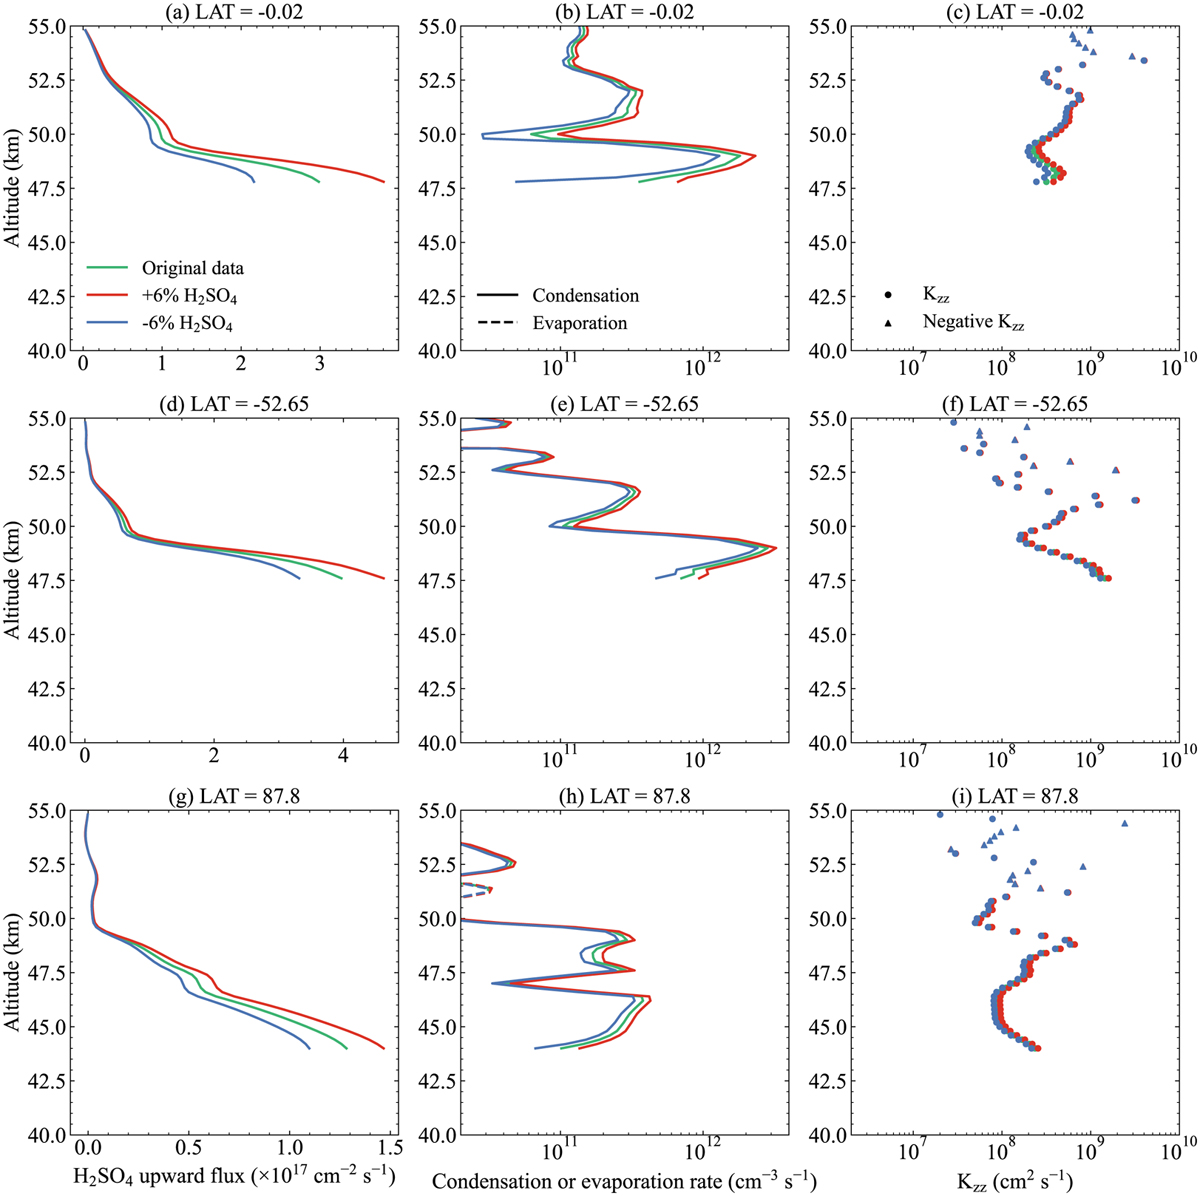
Uncertainty tests on corresponding cases in Figure 2. The left, middle, and right columns show H2SO4 vapor diffusion flux, the condensation or evaporation rate, and Kzz profiles, respectively. The green lines represent the original data. The red lines represent a 6% increase in the H2SO4 vapor column. The blue lines represent a 6% decrease in the H2SO4 vapor column.
Current usage metrics show cumulative count of Article Views (full-text article views including HTML views, PDF and ePub downloads, according to the available data) and Abstracts Views on Vision4Press platform.
Data correspond to usage on the plateform after 2015. The current usage metrics is available 48-96 hours after online publication and is updated daily on week days.
Initial download of the metrics may take a while.