Fig. A.2.
Download original image
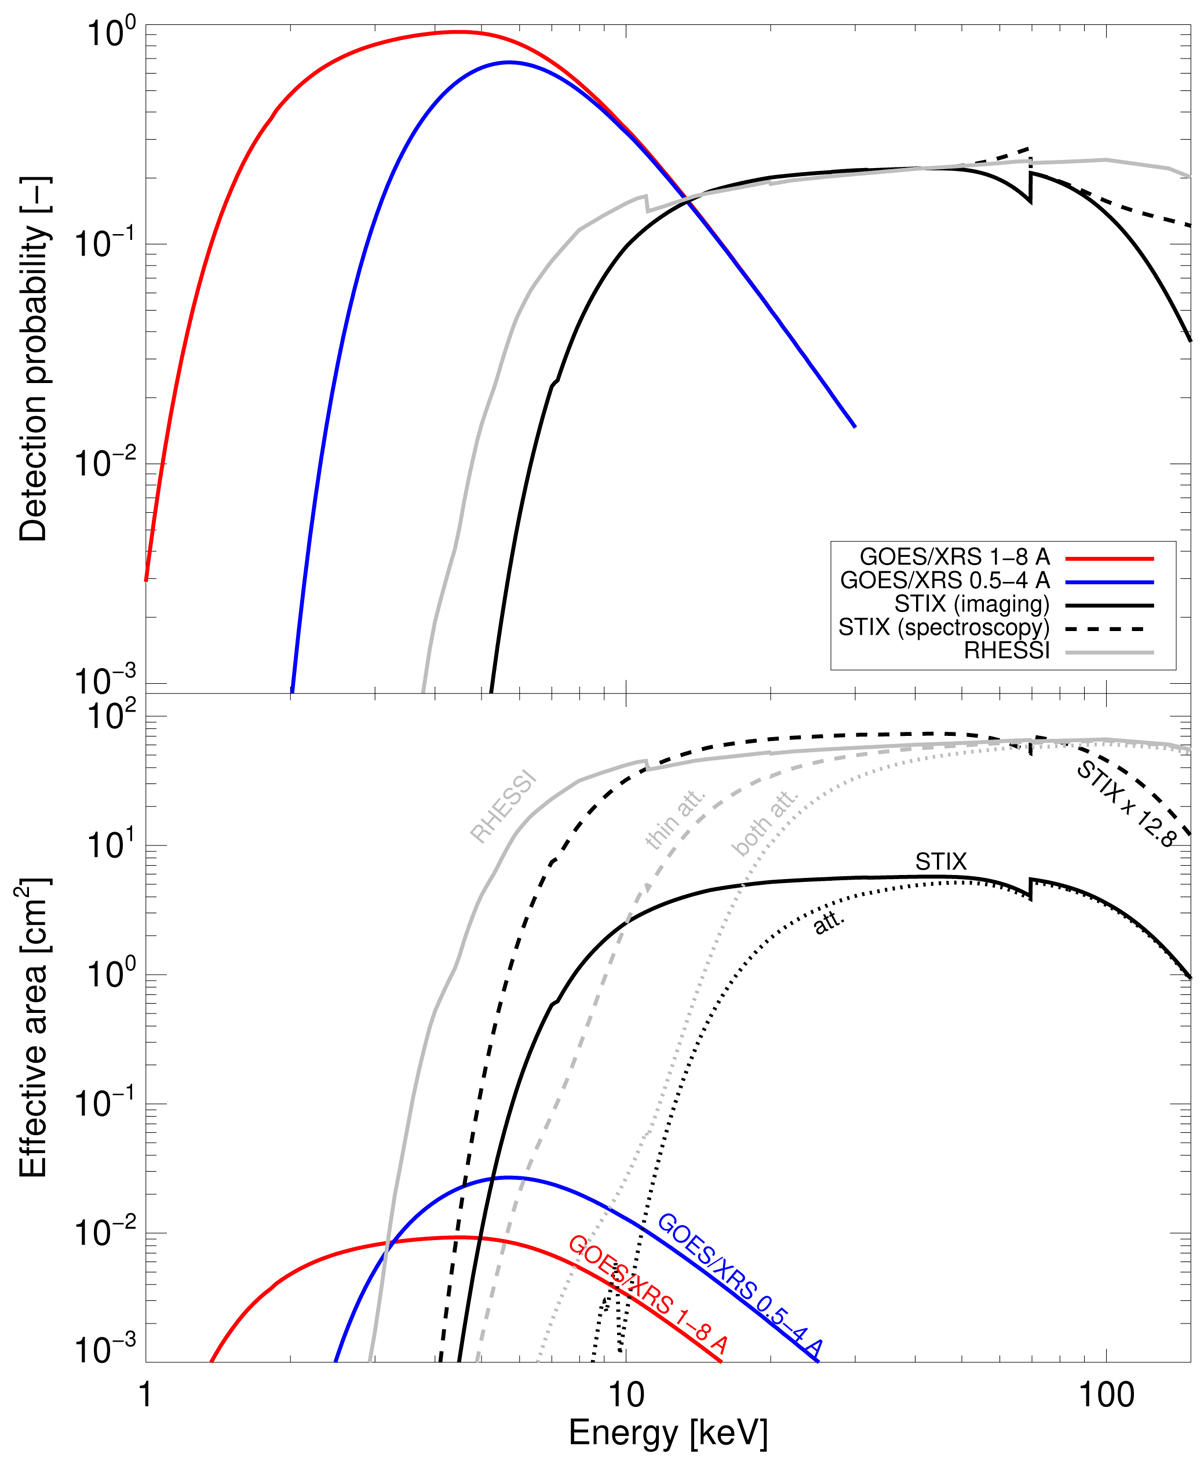
Detection probability of an incoming photon flux and effective area for various X-ray instruments as a function of energy. Top panel: Detection probability as a function of energy for GOES 1-8 Å (red), GOES 0.5-4 Å (blue), STIX imaging (solid black), STIX spectroscopy (dashed black), and RHESSI (gray). Bottom panel: Effective area as a function of energy for the same instruments. The plot includes the effect of the attenuators in RHESSI (thin attenuator in dashed gray; thin plus thick attenuators in dotted gray) and STIX (dotted black). The dashed black line represents the STIX effective area multiplied by a factor of 12.8 (=(0.28[AU])−2), which corresponds to the increased sensitivity at perihelion.
Current usage metrics show cumulative count of Article Views (full-text article views including HTML views, PDF and ePub downloads, according to the available data) and Abstracts Views on Vision4Press platform.
Data correspond to usage on the plateform after 2015. The current usage metrics is available 48-96 hours after online publication and is updated daily on week days.
Initial download of the metrics may take a while.