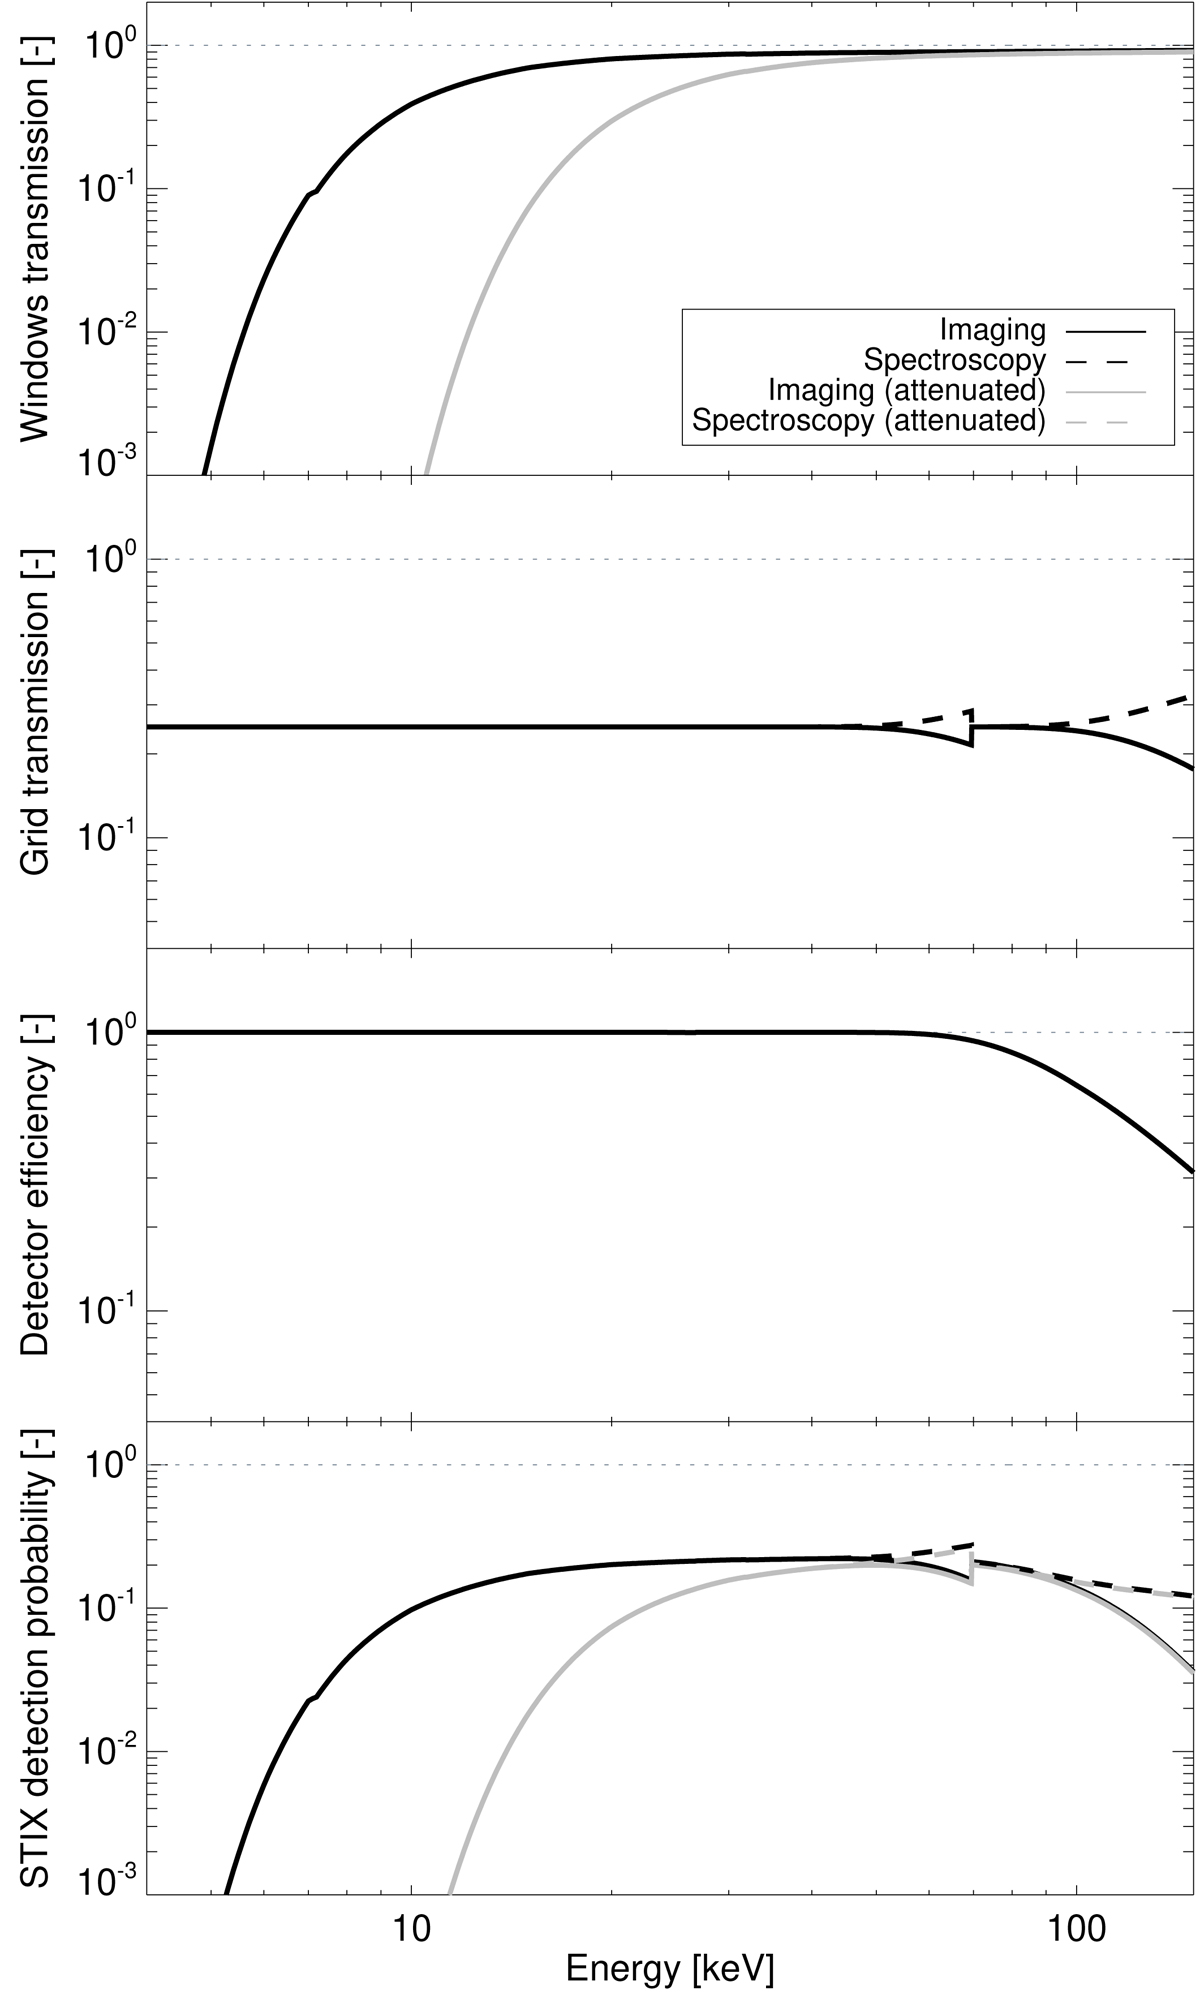
Fig. A.1.
Download original image
STIX detection probability of an incoming photon flux as a function of energy. From top to bottom, we show the windows’ transmission, the grid transmission, the detector efficiency, and the STIX detection probability, which is the convolution of the different components. The solid (dashed) black line shows the STIX imaging (spectroscopy) probabilities. In gray, we highlight the effect of the attenuator insertion. The horizontal dotted line indicates the value of 1.
Current usage metrics show cumulative count of Article Views (full-text article views including HTML views, PDF and ePub downloads, according to the available data) and Abstracts Views on Vision4Press platform.
Data correspond to usage on the plateform after 2015. The current usage metrics is available 48-96 hours after online publication and is updated daily on week days.
Initial download of the metrics may take a while.