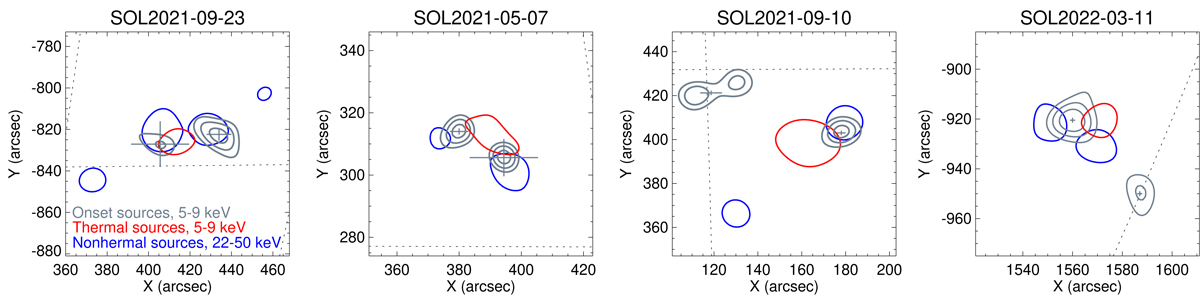
Fig. 7.
Download original image
Summary plot with the STIX reconstructed images for all events considered in this paper. Gray contours (50, 70, and 90% of the peak intensity) represent the images of the sources obtained during the onset interval, and the blue and red contours (50% of the peak intensity) the nonthermal (22–50 keV) and thermal (5–9 keV) images, respectively, obtained around the nonthermal peaks. The error on the location of the onset sources has been estimated by means of the FWDFIT algorithm, and they are shown as gray crosses.
Current usage metrics show cumulative count of Article Views (full-text article views including HTML views, PDF and ePub downloads, according to the available data) and Abstracts Views on Vision4Press platform.
Data correspond to usage on the plateform after 2015. The current usage metrics is available 48-96 hours after online publication and is updated daily on week days.
Initial download of the metrics may take a while.