Fig. 5.
Download original image
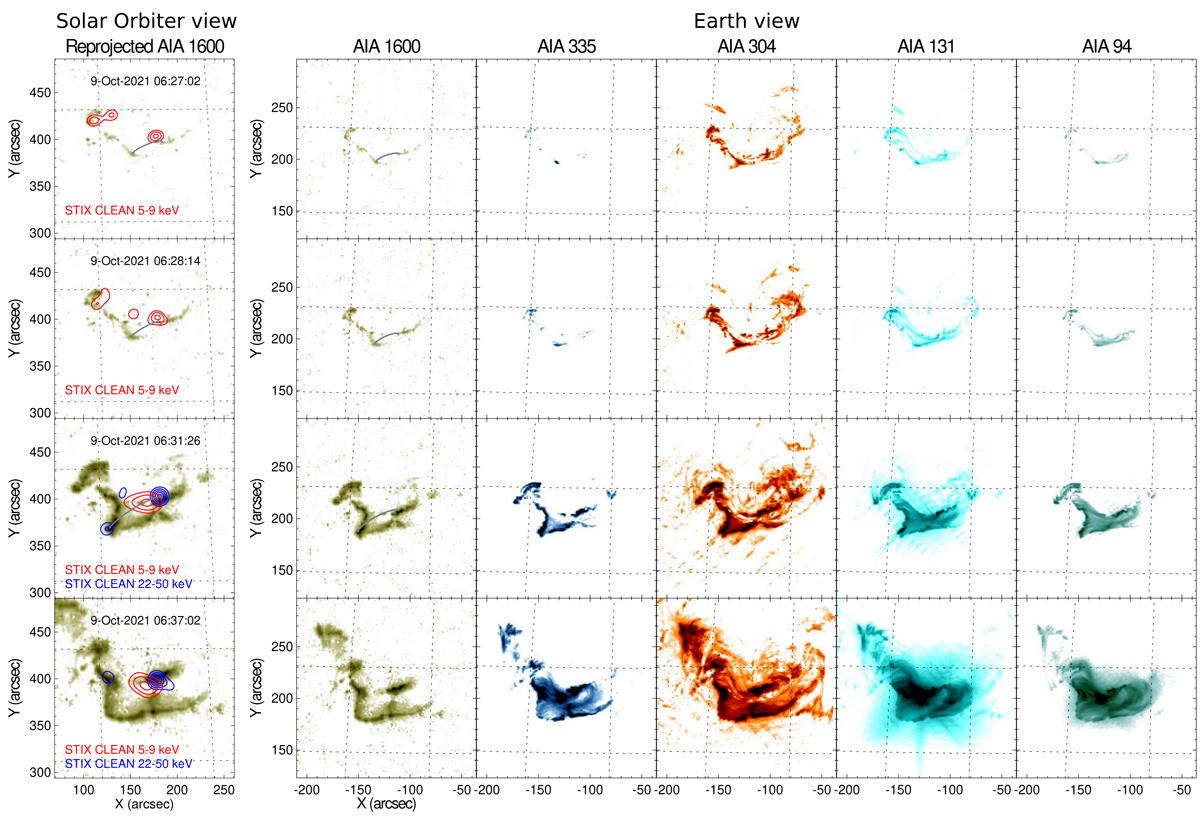
Solar Orbiter/STIX and pre-flare-subtracted SDO/AIA images of the SOL2021-10-09 event. The figure has the same format as Figs. 3 and 4 except that more time instances and AIA filters have been considered. The contour levels of the STIX images produced in the energy interval from 5 to 9 keV correspond to the 50, 70, and 90% of the maximum, whereas the ones produced within the 22–50 keV range are 50, 60, 70, 80, and 90% of the maximum.
Current usage metrics show cumulative count of Article Views (full-text article views including HTML views, PDF and ePub downloads, according to the available data) and Abstracts Views on Vision4Press platform.
Data correspond to usage on the plateform after 2015. The current usage metrics is available 48-96 hours after online publication and is updated daily on week days.
Initial download of the metrics may take a while.