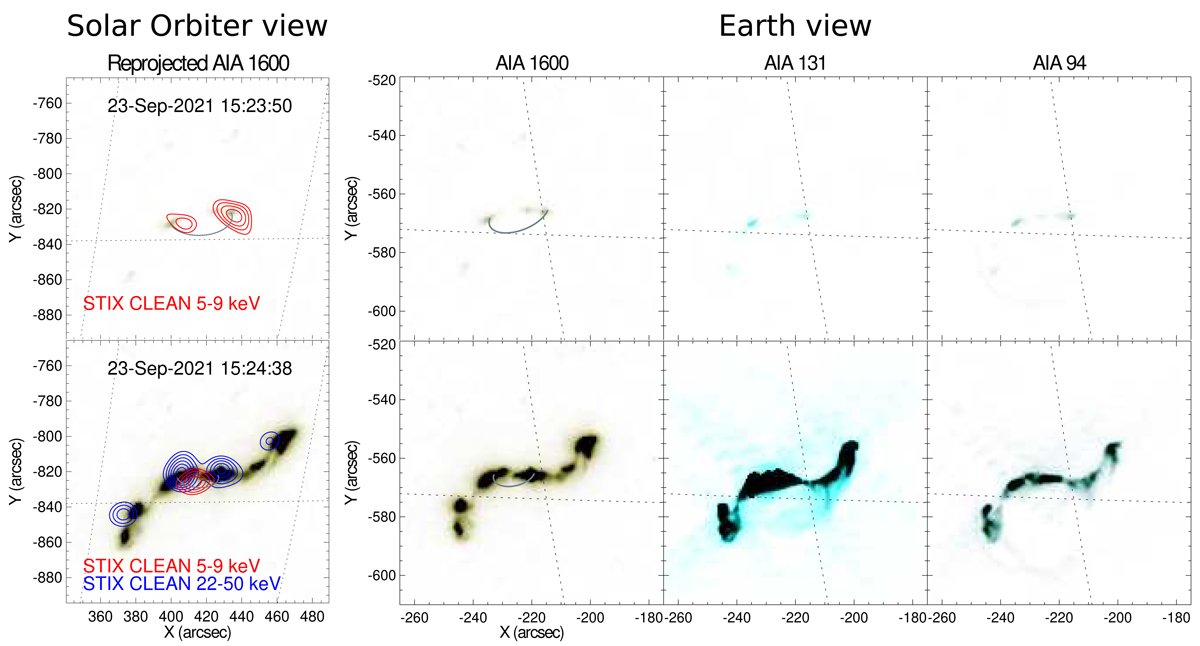
Fig. 3.
Download original image
Solar Orbiter/STIX and pre-flare-subtracted SDO/AIA images of the SOL2021-09-23 event. The leftmost column shows the STIX reconstructed images, as contour levels, overlaid on the re-projected AIA 1600 Å maps at two different instances: onset (top panels) and nonthermal peak (bottom panels). The integration intervals used for the STIX images are represented by the gray area in Fig. 2. The red contours (60, 70, 80, and 90% of the maximum) show the images reconstructed within the energy range from 5 to 9 keV, and the blue ones (40, 50, 60, 70, 80, and 90% of the maximum) from 22 to 50 keV. In order to guide the eye, semicircles perpendicular to the solar surface and connecting the flare ribbons are drawn in gray at the onset and nonthermal peak times. The three columns on the right show the three selected AIA bands, in time (rows). The AIA maps are the closest available to the central time of the STIX integration interval used for reconstructing the images. The same gray semicircles are plotted on top of the AIA 1600 Å maps as seen from Earth.
Current usage metrics show cumulative count of Article Views (full-text article views including HTML views, PDF and ePub downloads, according to the available data) and Abstracts Views on Vision4Press platform.
Data correspond to usage on the plateform after 2015. The current usage metrics is available 48-96 hours after online publication and is updated daily on week days.
Initial download of the metrics may take a while.