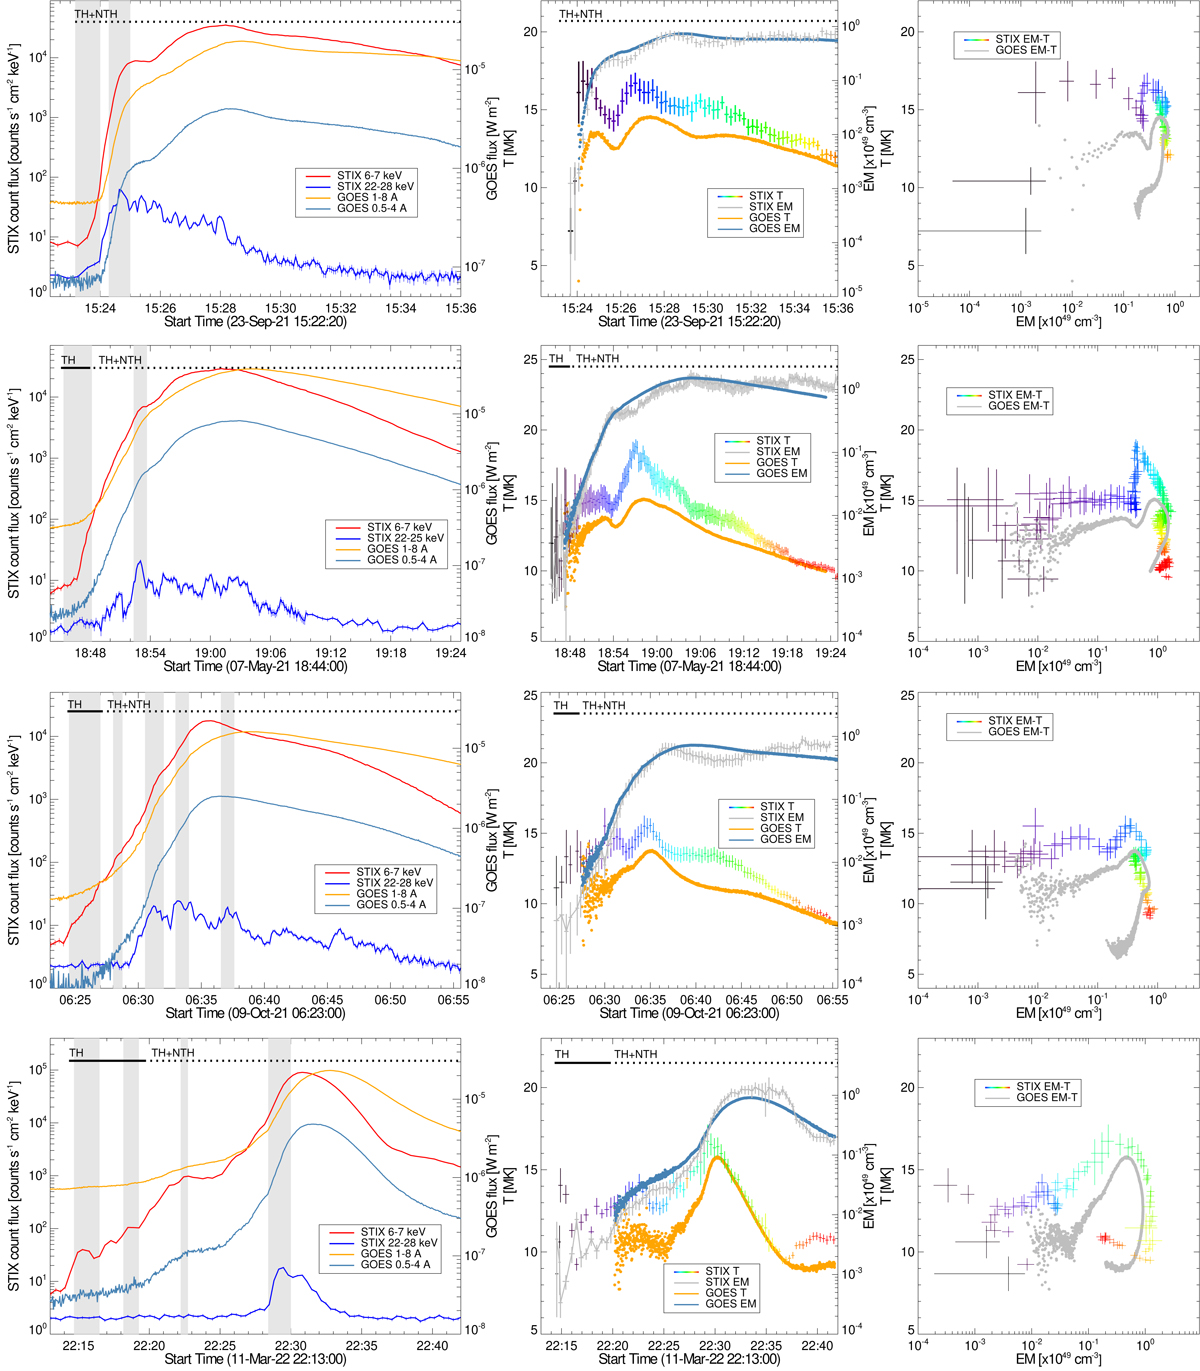
Fig. 2.
Download original image
Time histories of the Solar Orbiter/STIX and GOES/XRS fluxes and the isothermal parameters, temperature, and emission measure for all selected events. From top to bottom, the events are sorted by duration of the onset interval: SOL2021-09-23, SOL2021-05-07, SOL2021-10-09, and SOL2022-03-11. From left to right, we show the time evolution of the STIX and GOES fluxes, time profiles of the temperature and emission measure, and the correlation plot of the temperature as a function of the emission measure. The gray areas in the leftmost panels indicate the accumulation interval selected for producing the STIX images of Figs. 3–6. The horizontal black lines in the plots of the first two columns indicate the spectral model used at different times: purely isothermal (solid, TH) or isothermal with an additional nonthermal component (dotted, TH+NTH). The STIX emission measure–temperature color coding in the rightmost column matches that of the temperature time series in the central column.
Current usage metrics show cumulative count of Article Views (full-text article views including HTML views, PDF and ePub downloads, according to the available data) and Abstracts Views on Vision4Press platform.
Data correspond to usage on the plateform after 2015. The current usage metrics is available 48-96 hours after online publication and is updated daily on week days.
Initial download of the metrics may take a while.