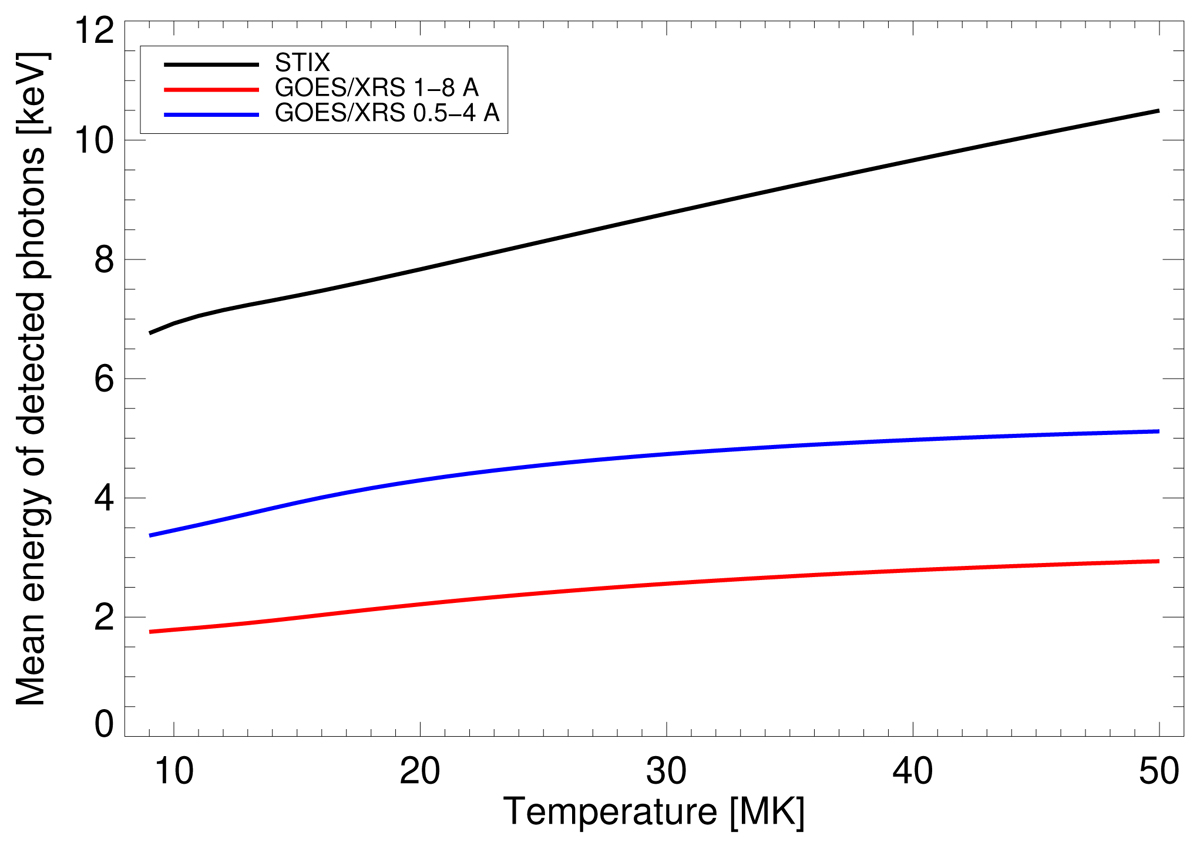
Fig. A.4.
Download original image
Mean energy of the detected photons of GOES/XRS and STIX against the temperature of the isothermal model. Red and blue curves show the mean energies of the GOES 1-8 Å and 0.5-4 Å bands, respectively, whereas the black line shows the STIX imaging mean energy. For all temperatures, we assumed a constant emission measure of 1047 cm−3. In this case, we do not make any distinction between the STIX imaging and spectroscopy mean energies since, for the considered flare spectra, there is no difference.
Current usage metrics show cumulative count of Article Views (full-text article views including HTML views, PDF and ePub downloads, according to the available data) and Abstracts Views on Vision4Press platform.
Data correspond to usage on the plateform after 2015. The current usage metrics is available 48-96 hours after online publication and is updated daily on week days.
Initial download of the metrics may take a while.