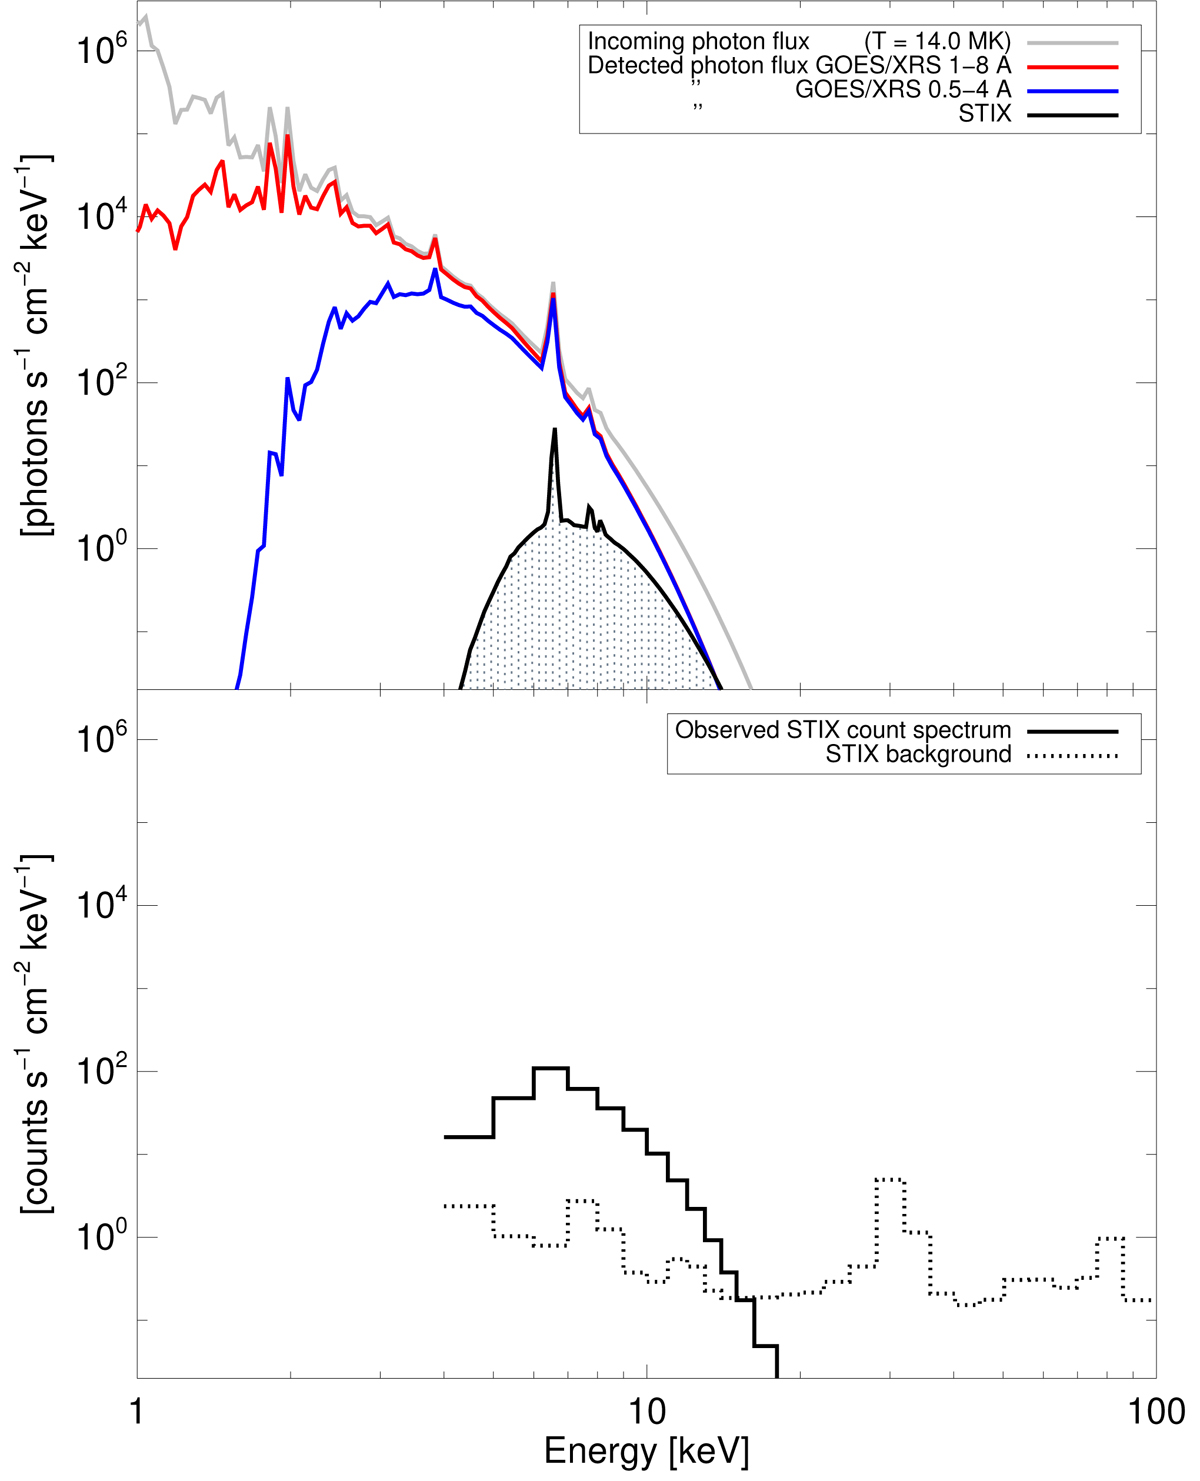
Fig. A.3.
Download original image
Simulated incoming and detected photon fluxes by STIX and GOES/XRS. Top panel: Simulated incoming photon flux, before passing through the entrance windows, for a purely isothermal simulation (T = 14 MK and EM = 1047 cm−3), shown with the gray curve. Red, blue, and black lines represent, respectively, the corresponding detected photon fluxes of GOES/XRS 1-8 Å, GOES/XRS 0.5-4 Å, and STIX. The hatched area highlights the common area under the different curves, i.e., the photons jointly detected by STIX and GOES. Bottom panel: Actual observed STIX count spectrum. In this case, we do not make any distinction between the STIX imaging and spectroscopy spectra since at these energies (< 20 keV) there is no difference.
Current usage metrics show cumulative count of Article Views (full-text article views including HTML views, PDF and ePub downloads, according to the available data) and Abstracts Views on Vision4Press platform.
Data correspond to usage on the plateform after 2015. The current usage metrics is available 48-96 hours after online publication and is updated daily on week days.
Initial download of the metrics may take a while.