Fig. 4.
Download original image
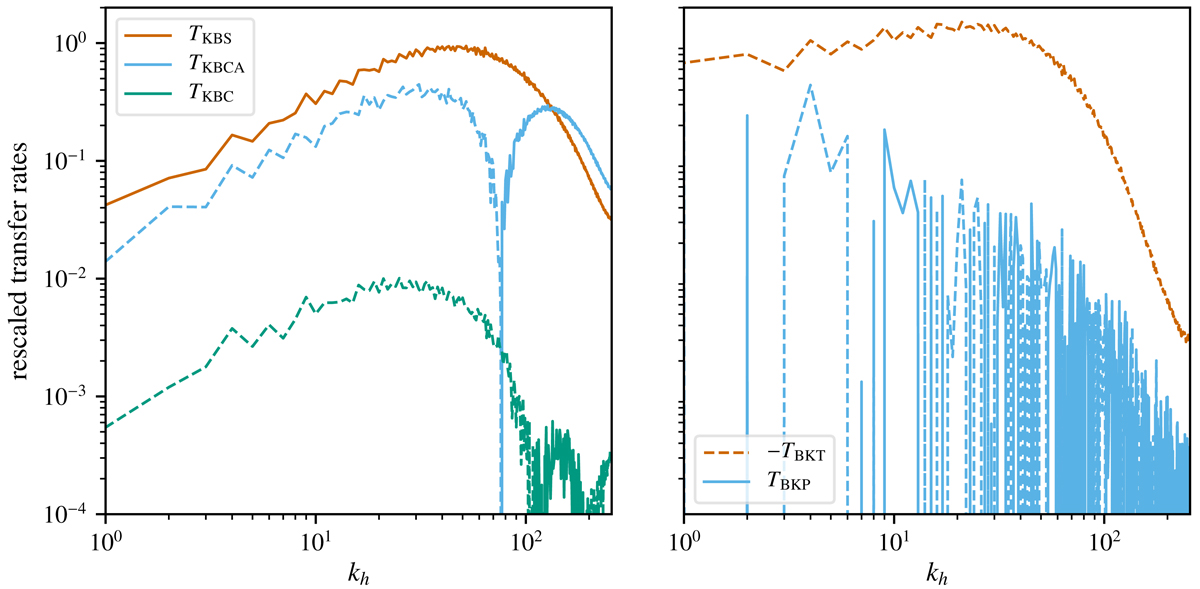
Transfer functions extracted from the convection zone on the 5123 grid and averaged over the kinematic stage of the dynamo. The panel on the left shows the transfer rates from the kinetic (K) to the magnetic (B) energy reservoir, whereas the panel on the right shows magnetic-to-kinetic energy transfer rates. The time averaging was performed such that, at each time t, all the transfer curves were rescaled by the maximum value of TKBS(kh). The resulting curves were then averaged over the time interval t ∈ (1.5τconv, 3τconv). Dashed lines represent negative transfer rates, while solid lines are used for positive rates.
Current usage metrics show cumulative count of Article Views (full-text article views including HTML views, PDF and ePub downloads, according to the available data) and Abstracts Views on Vision4Press platform.
Data correspond to usage on the plateform after 2015. The current usage metrics is available 48-96 hours after online publication and is updated daily on week days.
Initial download of the metrics may take a while.