Open Access
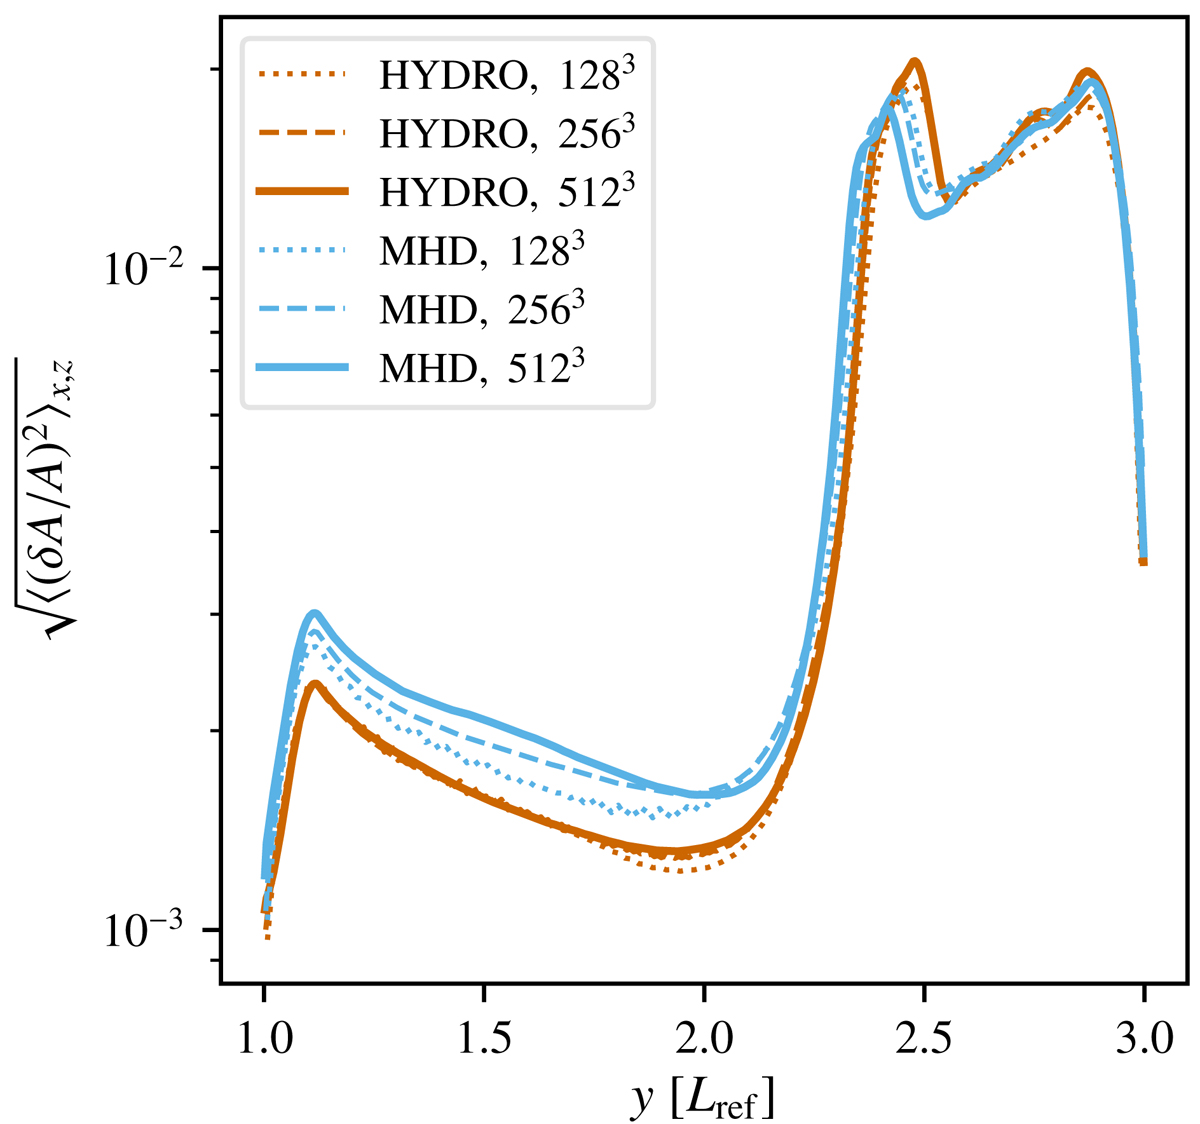
Fig. 10.
Download original image
Vertical profiles of the root-mean-square relative pseudo-entropy fluctuation in the MHD (light blue) and purely hydrodynamic simulations (vermilion), averaged over t ∈ (15τconv, 25τconv). The upper convective boundary is, on average, at the position of the peaks visible at y = (2.3 − 2.4) Lref.
Current usage metrics show cumulative count of Article Views (full-text article views including HTML views, PDF and ePub downloads, according to the available data) and Abstracts Views on Vision4Press platform.
Data correspond to usage on the plateform after 2015. The current usage metrics is available 48-96 hours after online publication and is updated daily on week days.
Initial download of the metrics may take a while.