Fig. 8.
Download original image
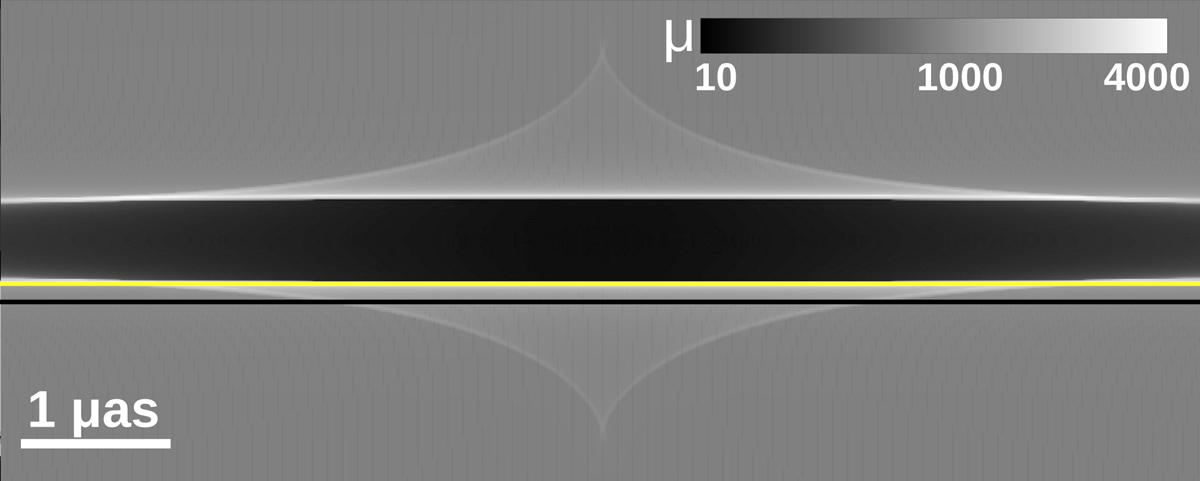
Caustics around a 1 M⊙ microlens on the side with negative parity at the redshift of the cluster lensing a background source at z = 2.091. The macromodel magnification in this region is ≈850, and the gray scale indicates the combined magnification μ of the macromodel and the microlens. The black horizontal band corresponds to the demagnification region that exists only for images with negative parity. The microlens can demagnify a lensed star down to μ ≈ 10 in this band. Lighter triangular regions above and below show high-magnification regions. The yellow horizontal line illustrates a trajectory grazing the bottom horizontal caustic, and the black line is for a trajectory 0.1 μas south of the yellow line. These lines correspond to the yellow and black curves in Fig. 9.
Current usage metrics show cumulative count of Article Views (full-text article views including HTML views, PDF and ePub downloads, according to the available data) and Abstracts Views on Vision4Press platform.
Data correspond to usage on the plateform after 2015. The current usage metrics is available 48-96 hours after online publication and is updated daily on week days.
Initial download of the metrics may take a while.