Fig. 6.
Download original image
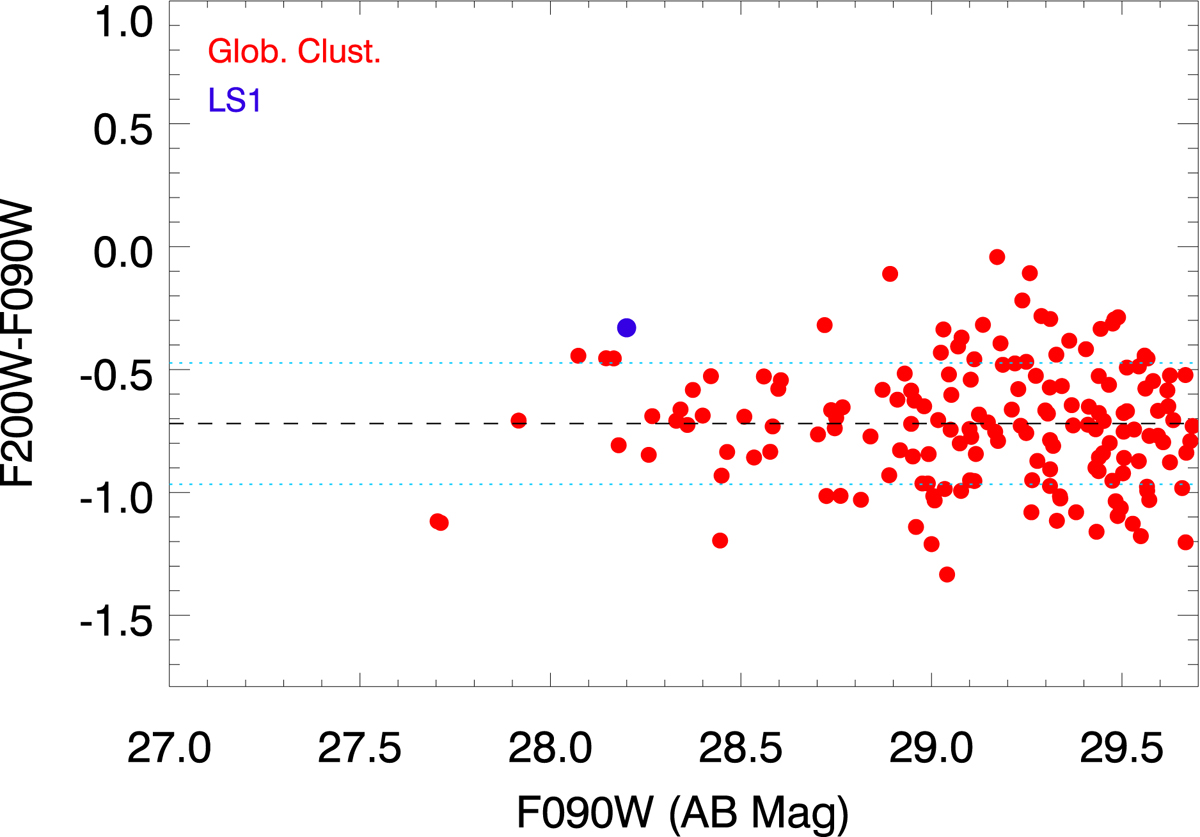
Color-color plot for the globular clusters. The red points correspond to globular clusters found in the central regions of M0416, and near LS1. The blue dot is for LS1. Magnitudes are computed after fitting the star-based PSF model. LS1 is clearly an outlier when compared with the globular clusters. Errors in the magnitudes have been omitted for clarity purposes. The horizontal dashed is the mean F200W − F090W of the globular clusters. The blue dotted ones represent 1 standard deviation.
Current usage metrics show cumulative count of Article Views (full-text article views including HTML views, PDF and ePub downloads, according to the available data) and Abstracts Views on Vision4Press platform.
Data correspond to usage on the plateform after 2015. The current usage metrics is available 48-96 hours after online publication and is updated daily on week days.
Initial download of the metrics may take a while.