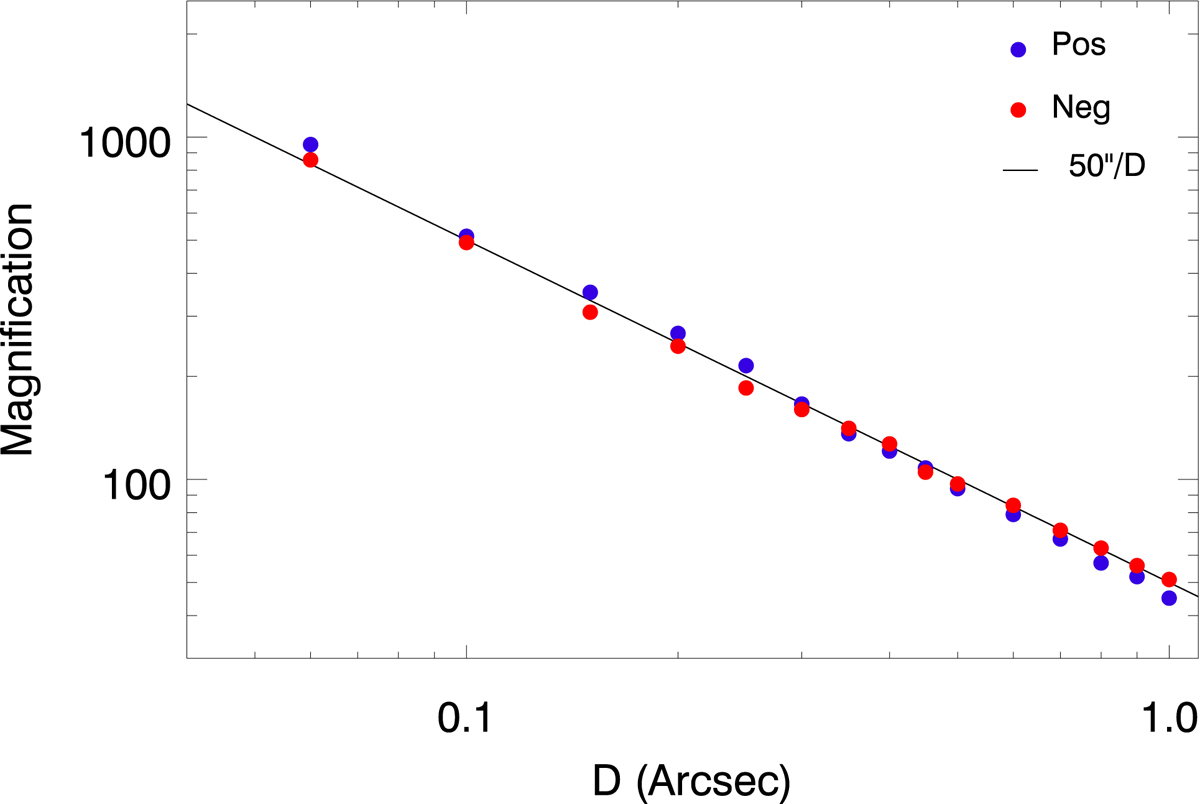
Fig. 5.
Download original image
Magnification versus distance. The solid black line represents the law μ = A/D, with D being the distance to the critical curve expressed in arcseconds and A = 62″. The blue and red points are measured magnification values from our lens model, at the position of the critical curve intersecting the arc and in a direction perpendicular to the critical curve. For the critical curve we assume the is at z = 2.091. The blue points correspond to magnification values measured on the side with positive parity (northwest of the white solid curve in Fig. 2) and the red points are for magnifications measured on the side with negative parity (southeast of the same curve). At a distance of D = 0.07″, the black curve predicts magnification ≈8855.
Current usage metrics show cumulative count of Article Views (full-text article views including HTML views, PDF and ePub downloads, according to the available data) and Abstracts Views on Vision4Press platform.
Data correspond to usage on the plateform after 2015. The current usage metrics is available 48-96 hours after online publication and is updated daily on week days.
Initial download of the metrics may take a while.