Fig. 4.
Download original image
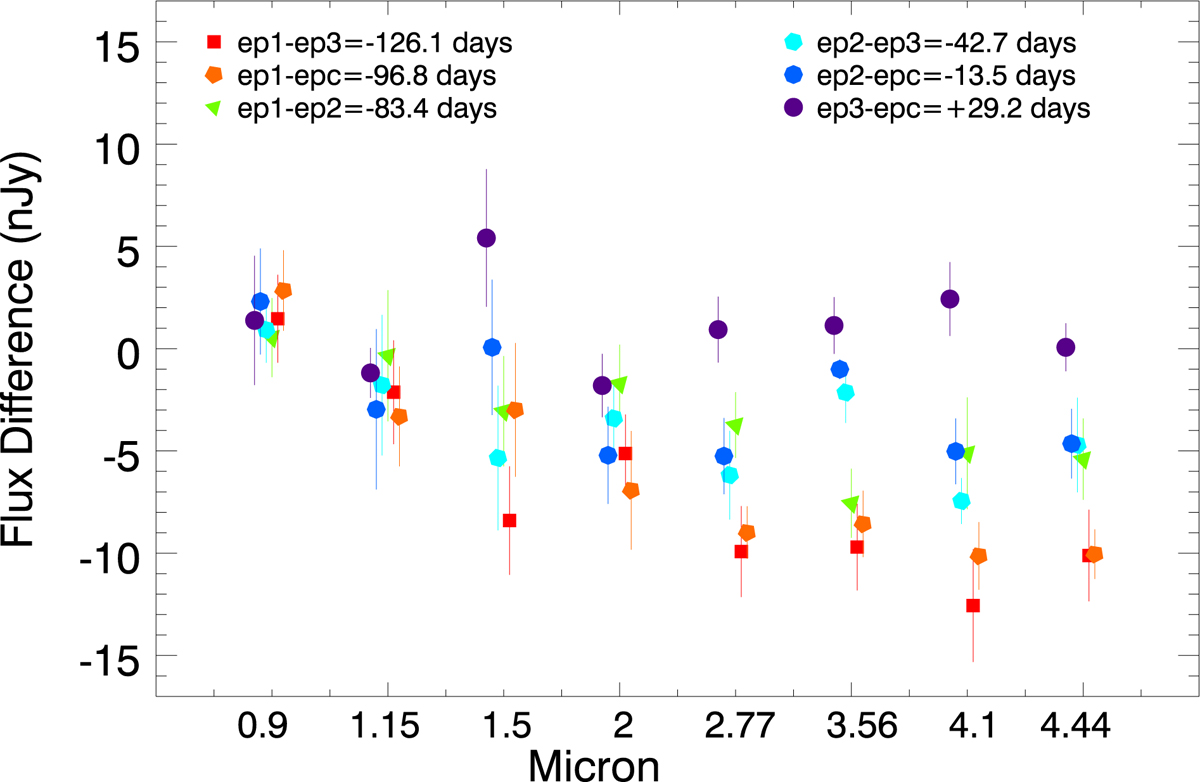
Time variability of LS1. The y-axis shows the difference in flux between different epochs in apertures of radius 0![]() 09 centered on LS1 (error bars are 1-σ derived from random positions outside the arc). Each color corresponds to a different combination of epochs, as indicated by the legend inside the figure. The legend gives the time of each epoch in days after Ep1.
09 centered on LS1 (error bars are 1-σ derived from random positions outside the arc). Each color corresponds to a different combination of epochs, as indicated by the legend inside the figure. The legend gives the time of each epoch in days after Ep1.
Current usage metrics show cumulative count of Article Views (full-text article views including HTML views, PDF and ePub downloads, according to the available data) and Abstracts Views on Vision4Press platform.
Data correspond to usage on the plateform after 2015. The current usage metrics is available 48-96 hours after online publication and is updated daily on week days.
Initial download of the metrics may take a while.